
What is Volume Weighted Average Price (VWAP) Indicator?
The Volume Weighted Average Price (VWAP) is a technical indicator that shows the average price a stock has traded at throughout the day, based on both volume and price.
- It helps traders identify the true average price of a stock for the day.
- Used by institutional investors and traders to find good entry & exit points.
- Acts as dynamic support and resistance for intraday trading.
How is VWAP Calculated?
VWAP is calculated using this formula:
VWAP=∑(Price×Volume)/(∑Volume}
Where:
Price = Average price of the stock during a specific period.
Volume = Number of shares traded in that period.
Summation = The total from market open to the current time.
How to Use VWAP in Intraday Trading?
Trend Confirmation:
-
Above VWAP = Bullish trend (buyers in control)
-
Below VWAP = Bearish trend (sellers in control)
If the stock is trading above VWAP and volume is high → Go Long (Buy)
If the stock is trading below VWAP and volume is high → Go Short (Sell)
Example:
-
Stock: ABC
-
VWAP = ₹2500
-
Price = ₹2510 (above VWAP) → Bullish trend → Buy
-
Price = ₹2490 (below VWAP) → Bearish trend → Sell
VWAP as Dynamic Support & Resistance
-
When price touches VWAP and bounces back – It acts as support.
-
When price touches VWAP and drops – It acts as resistance.
Example:
-
Stock: XYZ
-
VWAP = ₹3400
-
Price moves from ₹3450 to ₹3400 and bounces → Buy near VWAP
-
Price moves from ₹3350 to ₹3400 and drops → Sell near VWAP
VWAP Breakout Strategy
If a stock stays above VWAP for 15 minutes with high volume, it signals a strong uptrend.
Example:
-
Stock: BCD
-
VWAP = ₹1520
-
Stock breaks VWAP at ₹1525 with volume surge → Buy
-
Target = ₹1540
-
Stop-loss = ₹1515
VWAP Pullback Strategy
When a stock is in an uptrend and pulls back to VWAP, it often bounces off VWAP and continues the uptrend.
Example:
-
Stock: ABCD Bank
-
Stock rises from ₹1650 to ₹1680
-
Pulls back to VWAP at ₹1660 and holds → Buy
-
Target = ₹1690
-
Stop-loss = ₹1655
If you are looking for the best stockbroker I would recommend you to checkout this broker, or you can directly use the below link to open the account free of cost.
VWAP Chart Example:
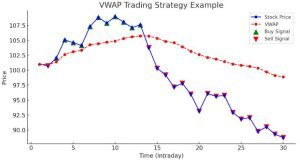
Here’s a VWAP trading chart example
- Blue line = Stock price
- Red dashed line = VWAP
- Green arrows = Buy signals (Price above VWAP)
- Red arrows = Sell signals (Price below VWAP)
This chart demonstrates how traders use VWAP as a dynamic support/resistance and entry/exit strategy.
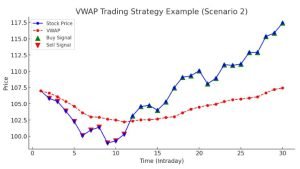
Here’s another VWAP trading chart example :
- Blue line = Stock price movement in a different trend.
- Red dashed line = VWAP acting as dynamic support & resistance.
- Green arrows = Buy signals (Price above VWAP).
- Red arrows = Sell signals (Price below VWAP).
This chart shows how VWAP can be used for intraday trading in different market conditions.
Step-by-Step Guide to Trading with VWAP:
Step 1: Identify Stocks for Intraday Trading
Before using VWAP, you need to pick the right stocks.
Criteria for Stock Selection:
-
Stocks with high liquidity (Nifty50 or BankNifty stocks).
-
Stocks with strong momentum (gap-up/gap-down, news, or high volume).
-
Stocks in trending markets (avoid sideways movements).
Step 2: Open Intraday Chart & Apply VWAP
Open a 5-minute or 15-minute chart of the selected stock.
Apply the VWAP indicator
Step 3: Identify Trend Using VWAP
- Above VWAP = Bullish (Buy on pullbacks).
- Below VWAP = Bearish (Sell on pullbacks).
- Near VWAP = Sideways (Avoid trading).
Step 4: VWAP Trading Strategies
VWAP Breakout Strategy (Best for Trending Markets)
-
Entry: Buy when stock breaks above VWAP with high volume.
-
Exit: Book profits at the next resistance level or 1% target.
-
Stop-loss: Below VWAP – 0.5%.
Example:
-
Stock: ABC
-
VWAP = ₹2500
-
Stock breaks VWAP at ₹2505 with high volume → BUY
-
Target: ₹2525
-
Stop-loss: ₹2495
VWAP Pullback Strategy (Best for Strong Uptrend/Downtrend)
-
Entry: Buy when stock touches VWAP and bounces up (bullish trend).
-
Exit: When stock reaches previous high or 1% gain.
-
Stop-loss: Below VWAP – 0.5%.
Example:
-
Stock: ACS
-
Stock rises from ₹3450 to ₹3500
-
Pulls back to VWAP at ₹3470 and bounces → BUY
-
Target: ₹3520
-
Stop-loss: ₹3460
VWAP Reversal Strategy (Best for Overbought/Oversold Stocks)
-
Entry: Short when the stock fails to break VWAP after a gap-up.
-
Exit: At previous support levels.
-
Stop-loss: Above VWAP + 0.5%.
Example:
-
Stock: QRS
-
Stock gaps up to ₹1525 but fails to hold above VWAP ₹1520 → SELL
-
Target: ₹1500
-
Stop-loss: ₹1530
Step 5: Manage Risk & Set Stop-Loss Properly
- Risk per trade = 1-2% of capital.
- Stop-loss = 0.5% – 1% below VWAP.
- Avoid trading 30 minutes before market close.
If you are looking for the best stockbroker I would recommend you to checkout this broker, or you can directly use the below link to open the account free of cost.
Best VWAP Trading Strategies Using Other Indicators:
VWAP is powerful, but combining it with other indicators gives more accurate signals.
Here are the best VWAP trading strategies with RSI, MACD, Bollinger Bands, and Supertrend for maximum accuracy.
VWAP + RSI (Best for Reversal Trades)
- VWAP shows trend direction (Above VWAP = Bullish, Below VWAP = Bearish).
- RSI confirms strength (Overbought = 70+, Oversold = 30-).
Strategy:
-
Buy when RSI < 30 (Oversold) and price touches VWAP from below.
-
Sell when RSI > 70 (Overbought) and price touches VWAP from above.
Example:
-
Stock: ACS
-
VWAP = ₹3400, RSI = 28 (Oversold) → BUY
-
Target: ₹3440
-
Stop-loss: ₹3380
Best for: Intraday pullback trades & reversals.
VWAP + MACD (Best for Trend Confirmation)
- VWAP confirms trend direction (Above VWAP = Buy, Below VWAP = Sell).
- MACD crossover confirms momentum (Bullish MACD = Uptrend, Bearish MACD = Downtrend).
Strategy:
-
Buy when MACD gives a bullish crossover (MACD line crosses Signal line up) and price is above VWAP.
-
Sell when MACD gives a bearish crossover and price is below VWAP.
Example:
-
Stock: XYZ
-
VWAP = ₹1520, MACD Bullish Crossover at ₹1530 → BUY
-
Target: ₹1550
-
Stop-loss: ₹1515
Best for: Intraday momentum trades & strong trends.
VWAP + Bollinger Bands (Best for Breakout Trading)
- VWAP acts as support/resistance.
- Bollinger Bands show volatility (Squeeze = Breakout coming).
Strategy:
-
Buy when price breaks above VWAP + Upper Bollinger Band.
-
Sell when price breaks below VWAP + Lower Bollinger Band.
Example:
-
Stock: DFC Bank
-
VWAP = ₹1650, Upper Bollinger Band Breakout at ₹1670 → BUY
-
Target: ₹1700
-
Stop-loss: ₹1640
Best for: Breakout trading & volatile stocks.
VWAP + Supertrend (Best for Trend Following)
- VWAP confirms trend direction.
- Supertrend shows buy/sell signals.
Strategy:
-
Buy when price is above VWAP and Supertrend is in BUY mode (Green).
-
Sell when price is below VWAP and Supertrend is in SELL mode (Red).
Example:
-
Stock: REL
-
VWAP = ₹2500, Supertrend Buy Signal at ₹2510 → BUY
-
Target: ₹2550
-
Stop-loss: ₹2490
Best for: Intraday & Swing Trading.
If you are looking for the best stockbroker I would recommend you to checkout this broker, or you can directly use the below link to open the account free of cost.
VWAP Trading Checklist for Intraday Traders:
This checklist will help you quickly validate trade setups before entering a VWAP-based trade. Use it before placing any order to increase accuracy and reduce losses.
Step 1: Identify Trade Setup
- Stock has high volume & liquidity (Avoid illiquid stocks).
- Stock is trending (Not sideways).
- VWAP confirms trend direction:
Above VWAP → Bullish (Look for buy).
Below VWAP → Bearish (Look for sell).
Check additional indicator for confirmation:
-
RSI < 30 (Buy) or RSI > 70 (Sell) → Reversal trade.
-
MACD Bullish/Bearish Crossover → Momentum trade.
-
Bollinger Band Breakout → Breakout trade.
-
Supertrend Buy/Sell Signal → Trend trade.
Step 2: Set Entry & Exit Levels
- Entry near VWAP (Avoid chasing the price).
- Set Stop-Loss: 0.5% – 1% below VWAP (Risk management).
- Set Target: Based on nearest resistance/support.
- Risk-to-Reward Ratio ≥ 1:2 (For profitable trades).
Step 3: Confirm Market Conditions
- Check Nifty/Bank Nifty trend (Avoid trades against the market).
- Avoid trading during high volatility news events (RBI policy, budget, etc.).
- Avoid trading 30 minutes before market close (High volatility & manipulation).
Step 4: Enter Trade & Manage Risk
- Place trade with proper position sizing (Max risk = 1-2% of capital).
- Keep emotions in control (No revenge trading).
- Use a trailing stop-loss if the stock moves in your favor.
- Exit trade if it moves against you (Stick to Stop-Loss, No averaging down).
Step 5: Review & Track Trades
- Note down the trade details in a journal (Entry, Exit, P&L, Mistakes, Learnings).
- Analyze why a trade was successful or failed.
- Improve strategy based on performance.
Is VWAP a Lagging Indicator?
Yes, VWAP is a lagging indicator because it is based on past price and volume data. It calculates the average price of a stock weighted by volume over a specific time period (usually a day). Since it updates with each new price tick, it reacts to price movements rather than predicting them.
Why is VWAP Considered Lagging?
It depends on historical data – VWAP is calculated using past prices and volumes, making it inherently delayed in reflecting sudden price changes.
More reliable as the day progresses – At the market open, VWAP can be highly volatile, but as more data accumulates, it becomes more stable.
Not predictive – Unlike leading indicators (like RSI or MACD crossover), VWAP does not predict price movements; it only confirms trends.
Does This Mean VWAP is Useless? NO!
Even though VWAP is a lagging indicator, it is highly valuable for:
Intraday traders – It helps identify the stock’s true average price and acts as a dynamic support/resistance level.
Institutions & big players – Many hedge funds and large traders use VWAP to execute large orders without moving the market.
Combining with leading indicators – When used with RSI, MACD, or Bollinger Bands, VWAP can improve trade accuracy.
Pro Tip: Use VWAP for Confirmation, Not Prediction!
Instead of relying only on VWAP, combine it with:
- RSI for reversals
- MACD for momentum
- Bollinger Bands for breakouts
This way, you get the best of both worlds, trend confirmation from VWAP and predictive signals from leading indicators!
Conclusion: Mastering VWAP for Profitable Trading
VWAP is one of the most powerful indicators for intraday trading, helping traders identify trend direction, entry points, and key support/resistance levels. When combined with RSI, MACD, Bollinger Bands, or Supertrend, VWAP becomes even more effective in filtering high-probability trades.
However, no indicator is 100% accurate. It’s crucial to:
- Follow risk management (Use stop-loss & proper position sizing).
- Avoid trading solely based on VWAP, always use confirmation from volume & other indicators.
Backtest your strategy and track performance with a trading journal to improve over time. - If used correctly, VWAP can give you an edge in the stock market, but discipline, patience, and a solid strategy are key to long-term success!
More importantly instead of trading directly first observe for couple of session whether they are working according to you.
What I mean is to do paper trading instead of live trading with your cash. Check if you were in real time trade would this has been possible and try to implement and make strategies accordingly.
Please, understand there is no 100% sure method which will make your trade every time successful, i know some people may give you guarantee to have 100% success but its next to impossible.
So, better learn it through experiencing it and I hope you will definitely going to succeed.
If you are looking for the best stockbroker I would recommend you to checkout this broker, or you can directly use the below link to open the account free of cost.
If you are a beginner in trading and investing, please read this amazing guide on how share market works in India?
In case you want to know how much you need to save every month to reach your financial goals check out Moneycontain Monthly SIP Calculator with inflation here.
Do you know the concept of present value of your future money, if not then you should.
Just like 100 rupees in your pocket today will not have value of 100 rupees after 5 years, similarly 100 rupees you receive in future, invested today won’t have the same value. ?Confused??
Check moneycontain present value calculator and ultimate guide on NPV here.
If you are looking for making an FD fixed deposit than do check best banks in India with Highest FD returns and calculate the value of your FD Moneycontain free FD calculator with inflation.
If, you have liked the content please do share it with your friends or on social media, as sharing do bring the good karma. Please leave comments if you have any questions or feedback below.
Note: Please do not take this as any recommendation, to trade or invest. This is just for reference, to make you understand more about the VWAP Indicator and its importance, under no circumstances intended to be used or considered as financial or investment advice, a recommendation or an offer to sell, or a solicitation of any offer to buy any securities or other form of financial asset.
Please do your own research and make investment. Moneycontain will not be responsible for any of your losses at all. The point made is for educational purpose only. All investments are subject to risks, which should be considered prior to making any investments.
Disclaimer :
This content is for educational purposes only and should not be considered financial or investment advice. Trading in the stock market involves significant risk, and past performance does not guarantee future results. Always do your own research and consult with a qualified financial advisor before making trading decisions. We are not responsible for any financial losses incurred due to the use of this information. Trade wisely!


