⚡ Most Traders Look at Option Chain… But Don’t Understand It
You open the option chain and see:
- Numbers everywhere
- Calls, puts, IV, OI
- Prices moving fast
👉 And it feels overwhelming.
So most traders:
❌ Ignore it
❌ Or use it incorrectly
👉 But here’s the truth:
🧠 Option Chain is the closest thing to “market reality” you can see
If you understand it properly:
👉 You can identify:
- Support & resistance
- Market sentiment
- Smart money positioning
🧠 What is Option Chain? (Simple but Powerful)
Option chain is:
👉 A table showing all available options contracts for a stock/index
It includes:
- Strike prices
- Call options (left side)
- Put options (right side)
- Data like IV, OI, volume
📊 How Option Chain Looks ?
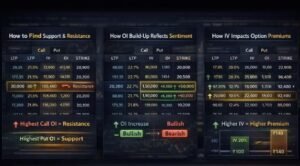
🧩 Understanding Key Columns (WITH REAL LOGIC)
Let’s break the MOST IMPORTANT parts 👇
1. 🎯 Strike Price (Center Column)
👉 The price at which you can buy/sell the underlying
Example:
- Nifty at 20,000
- Strike prices:
- 19,800
- 20,000
- 20,200
2. 📈 Call Side (Left)
👉 Represents bullish bets
People buying calls expect:
👉 Market to go UP
3. 📉 Put Side (Right)
👉 Represents bearish bets / protection
People buying puts expect:
👉 Market to go DOWN
4. 🧠 Open Interest (OI) – MOST IMPORTANT
👉 OI = Number of active contracts
This tells you:
👉 Where traders are placing bets
💥 Example:
Strike |
Call OI |
Put OI |
|---|---|---|
20,200 |
HIGH |
LOW |
20,000 |
MEDIUM |
MEDIUM |
19,800 |
LOW |
HIGH |
🔍 Interpretation:
- High Call OI → Resistance
- High Put OI → Support
👉 Why?
Because:
- Call writers defend resistance
- Put writers defend support
Learn How To Read Option Chain Data of Nifty, BankNifty, Stocks with Examples
💥 REAL EXAMPLE (GAME CHANGER)
Let’s say:
👉 Nifty at 20,000
Data:
- 20,200 CE OI = 1,00,000 (Very High)
- 19,800 PE OI = 1,20,000 (Very High)
🧠 What this means:
👉 Resistance = 20,200
👉 Support = 19,800
💡 Trade Insight:
- Market likely to stay between 19,800 – 20,200
👉 Range-bound market
⚡ OI CHANGE (ADVANCED EDGE)
Not just OI — watch Change in OI
Scenario 1:
👉 Price ↑ + OI ↑
= Strong bullish trend
Scenario 2:
👉 Price ↓ + OI ↑
= Strong bearish trend
Scenario 3:
👉 Price ↑ + OI ↓
= Short covering
👉 This is where beginners get confused
👉 And pros make money
💰 IV (Implied Volatility) – PRICING POWER
In simple terms:
👉 IV tells you how much the market expects the price to move in the future
📊 Easy Way to Think About IV
- High IV = Big expected moves → Options become expensive
- Low IV = Small expected moves → Options become cheaper
🔍 Simple Example
Let’s say:
- Stock is at ₹100
Now:
- If IV is high → option premium = ₹10
- If IV is low → option premium = ₹5
👉 Same stock, same strike… different pricing
Because:
👉 Market expects more movement in one case
⚡ Why IV Matters
IV directly affects:
- Option price
- Risk
- Profit potential
👉 That’s why professional traders always check IV before trading
👉 “Now here’s where things get interesting…”
👉 “IV is not the same for all options — and that’s exactly what creates volatility skew.”
👉 IV affects option premium
🔍 Example:
Same strike:
- IV = 20% → Premium = ₹100
- IV = 30% → Premium = ₹140
👉 Price increased without market move
💡 Insight:
👉 High IV = Expensive options
👉 Low IV = Cheap options
👉 This directly connects to:
- Volatility Skew
- Option pricing
🔥 HOW TO READ OPTION CHAIN LIKE A PRO
This is where most content fails.
Let’s go deeper 👇
🎯 Step 1: Identify Strong OI Zones
Find:
- Highest Call OI → Resistance
- Highest Put OI → Support
🎯 Step 2: Watch OI Shift
If OI shifts upward:
👉 Market is preparing to move higher
🎯 Step 3: Combine with Price Action
Option chain alone is NOT enough
👉 Combine with:
- Chart levels
- Trend
💥 REAL TRADE EXAMPLE (WITH LOGIC)
👉 Bank Nifty at 45,000
Data:
- 45,500 CE OI very high
- 44,500 PE OI very high
Interpretation:
👉 Range = 44,500 – 45,500
Strategy:
👉 Sell options (range strategy)
💰 Profit Logic:
If market stays in range:
- Options lose value (theta decay)
👉 Seller profits
🧠 Why Option Chain Alone is NOT Enough (Price Action Matters)
Option chain shows you:
👉 Where traders are positioned
But it does NOT tell you:
👉 What price will do next
That’s where price action comes in.
👉 Price action means:
- Watching how price behaves near key levels
- Understanding buyer vs seller reaction
💥 Example:
From option chain:
- Support = 19,800 (High Put OI)
Now price reaches 19,800…
Scenario 1:
👉 Strong bounce (bullish candle)
✅ Buyers are active
👉 Trade idea: Buy / bullish
Scenario 2:
👉 Weak reaction / breakdown
❌ Support fails
👉 Trade idea: Avoid or bearish
🎯 Key Insight
👉 Option Chain = Where to watch
👉 Price Action = What to do
👉 Combining both gives:
✔ Better entries
✔ Higher probability trades
✔ Fewer false signals
Trading Just Got a Serious Upgrade
For years, traders had to choose:
-
❌ Power (old heavy terminals)
-
❌ Flexibility (modern web apps)
But rarely both.
Dhan just solved that.
With the launch of DEXT T3, Dhan brings back the power of classic trading terminals — combined with the flexibility of modern platforms.
👉 And this is not just another update…
👉 This is a serious upgrade for real traders.
Dhan DEXT T3 is a downloadable trading terminal for Windows and Mac that offers advanced charting, customizable layouts, ultra-fast execution, and seamless integration with the Dhan trading ecosystem built for:
-
Multi-screen professionals
Unlike browser-based platforms, it gives you:
✔ Native performance
✔ Ultra-low latency
✔ Full customization
👉 Think of it as your personal trading cockpit.
DEXT T3 brings together market data, charts, order placement, and positions into a streamlined interface designed for active trading. It allows you to monitor markets in real time, react quickly to price movements, and execute trades with precision.
The terminal is designed to keep everything a trader needs within reach – helping you stay focused on the markets without switching between multiple screens. With DEXT T3, trading on Dhan becomes faster, more intuitive, and built for the way modern traders operate.
🔥 Why DEXT T3 is Different ?
DEXT T3 comes with 30+ widgets – built different, with features you won’t find on any other terminal:
Volatility Skew
Fundamentals
Futures chain
VWAP Indicator
7 Prebuilt Layouts
Trade on Charts
Speed of Keys
Realtime Greeks
20 Depth Market Data (price Ladder)
Link Widgets and much more
DEXT T3 combines:
Old Terminals |
Modern Platforms |
|---|---|
High speed |
Easy access |
Custom layouts |
Clean UI |
Multi-screen support |
Device flexibility |
👉 DEXT T3 = Best of both worlds
🚀 Ready to Trade Like a Pro?
You’ve seen what DEXT T3 + Dhan ecosystem can do.
Now it’s your turn.
⚡ Ultra-fast execution
📊 Advanced tools
🧠 Smart risk management
👉 Everything you need to level up your trading
🔓 Open Your Free Dhan Account Now
Start using DEXT T3 today and experience the difference
🚨 COMMON MISTAKES (IMPORTANT)
❌ Blindly trusting OI
OI can change quickly
❌ Ignoring IV
You may buy overpriced options
❌ Overcomplicating data
Keep it simple
❌ Trading without context
Always combine with charts
🧠 ADVANCED INSIGHT (THIS IS GOLD)
👉 Most traders think:
“High OI = direction”
👉 WRONG
👉 Reality:
High OI = where positions are built
NOT direction guarantee
👉 Direction comes from:
- OI change
- Price movement
- IV behavior
🔄 HOW THIS CONNECTS TO YOUR SYSTEM
Now connect everything:
- Option Chain → Market positioning
- IV → Pricing
- Skew → Mispricing
- Slippage → Execution
- Ladder → Entry precision
👉 This is how pro traders think
🧠 FINAL VERDICT
Option chain is not just data.
👉 It is:
✔ Market psychology
✔ Positioning
✔ Risk distribution
👉 If you learn to read it properly:
You stop guessing
You start interpreting
🚀 BOTTOM LINE
Most traders:
❌ Trade blindly
Smart traders:
✅ Read option chain
✅ Understand positioning
✅ Trade with logic
👉 And that’s the difference
🚀 Want to Stop Losing Money Silently?
You don’t need a new strategy.
👉 You need a better system.
🔓 Upgrade Your Trading Setup
- Faster execution
- Better tools
- Lower slippage
👉 Start using a performance-focused platform like Dhan
❓ FAQs
🔹 What is option chain in simple terms?
A table showing all available options with price, OI, IV, and volume.
🔹 How to find support and resistance?
High Put OI = Support
High Call OI = Resistance
🔹 Is option chain useful for beginners?
Yes, but start with basics like OI and strike price.
🔹 What is OI in option chain?
Open Interest shows number of active contracts.
🔹 Can option chain predict market?
Not exactly — but it shows positioning and probability.
I hope you now have a thorough understanding of how to read option chain data and do better analysis of the table. Fundamentalist and technical analysts also use the option chain data as an important data point as an authority for their view.
Even for chartists, option chain data trends can be an additional evidence to be considered. Once you understand the option chain, choosing the best strike price becomes easy.
Apart from this, there is another very important term which should be used with and known to an option trader termed as Option Greeks. The Option Greeks represent the unanimity of the stock market.
It help us to know how the option will behave to changes in certain variables attached with the pricing of an option contract. Greeks is a term used in the options trading to represent the different dimensions of risk involved if you take any position in option trading.
You can go in depth in to option greeks and delta here and learn how option chain with delta helps you in many ways.