Intraday trading, or day trading, involves buying and selling stocks within the same trading day. Unlike long-term investing, intraday trading focuses on capitalizing on short-term price movements.
Trading is like cricket. You don’t need to hit every ball—just pick the right ones.
This guide aims to simplify the world of intraday trading, making it accessible even to those new to the stock market.
Understanding Intraday Trading
Imagine buying a toy in the morning for ₹100 and selling it by evening for ₹110. You’ve made a ₹10 profit in a single day. Intraday trading works similarly but with stocks. Traders aim to buy low and sell high (or vice versa) within the same day to earn profits.
5 Best Intraday Trading Strategies
Let’s explore some of the most effective intraday trading strategies, explained in simple terms with real-life examples from the Indian stock market.
1. Breakout Strategy
Concept: Stocks often trade within a specific price range. A breakout occurs when the stock price moves beyond this range, indicating a potential new trend.
Example: Suppose Reliance Industries has been trading between ₹2,400 and ₹2,500. If it suddenly rises above ₹2,500 with high trading volume, it suggests a breakout, signaling a potential upward trend.
Pro Tip: Use technical indicators like volume and moving averages to confirm breakouts.
Real-Time Example: Applying the Breakout Strategy
Let’s consider a real-time example using the breakout strategy:
-
Stock: Infosys
-
Resistance Level: ₹1,500
-
Breakout Point: Stock price moves above ₹1,500 with increased volume.
-
Action: Buy at ₹1,505
-
Target: ₹1,550
-
Stop-Loss: ₹1,490
Outcome: If the stock reaches ₹1,550, you make a ₹45 profit per share. If it drops to ₹1,490, you limit your loss to ₹15 per share.
2. Moving Average Crossover Strategy
Concept: This strategy uses two moving averages—a short-term and a long-term. A buy signal is generated when the short-term average crosses above the long-term average, and a sell signal when it crosses below.
Example: If the 9-day EMA (Exponential Moving Average) of Infosys crosses above its 21-day EMA, it may indicate a bullish trend, suggesting a buying opportunity.
Pro Tip: Combine this strategy with other indicators like RSI for better accuracy.
This strategy uses two moving averages (short-term and long-term). When the short-term MA crosses above the long-term MA, it’s a buy signal. When it crosses below, it’s a sell signal.
Keep in mind the crossover, backed by good volume, confirmed trend continuation.
Use volume as a filter. Ignore fake crossovers during low-volume periods (like lunchtime).
3. Scalping Strategy
Concept: Scalping involves making numerous small trades throughout the day to profit from minor price changes.
Example: A trader buys shares of HDFC Bank at ₹1,500 and sells them at ₹1,505, making a ₹5 profit per share. By repeating this process multiple times, small profits accumulate.
Pro Tip: Scalping requires quick decision-making and is best suited for highly liquid stocks.
4. Gap and Go Strategy
Concept: This strategy focuses on stocks that open significantly higher or lower than their previous closing price, known as a “gap.”
Example: If TCS closes at ₹3,000 and opens at ₹3,100 the next day, the ₹100 difference is a gap. If the stock continues to rise after the opening, traders may “go” with the trend.
Pro Tip: Ensure the gap is accompanied by high volume to confirm the trend.
When a stock gaps up or gaps down at open:
-
Wait for first 15 minutes.
-
If it holds support/resistance and forms a breakout → entry point.
Don’t rush in immediately on gap-ups/downs. Wait for price stability or breakout confirmations to avoid fake-outs.
5. Reversal Strategy
Concept: This strategy aims to identify points where a stock’s price trend is likely to reverse.
Example: If Bajaj Auto has been declining and shows signs of stabilizing at ₹3,200, traders might anticipate a reversal and consider buying.
Pro Tip: Use candlestick patterns and support/resistance levels to identify potential reversals.
Use RSI to catch overbought (>70) or oversold (<30) zones:
-
RSI > 70 = Possible reversal down
-
RSI < 30 = Possible reversal up
RSI + candle pattern gave a perfect low-risk reversal setup.
Never trade on RSI alone. Combine it with price action or candles (like Doji, Hammer) for better reliability.
Breakout, Candlestick Patterns and Risk-Reward Ratio
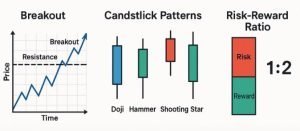
1. Breakout Chart
What It Shows:
-
A blue zig-zag line going up represents the price of a stock over time.
-
There’s a horizontal dashed line marked as “Resistance.”
-
The point where the price jumps above this line is labeled “Breakout.”
What It Means:
-
Stocks often bounce between a high (resistance) and a low (support).
-
A breakout happens when the price moves above the resistance level.
-
It’s like a cricket ball breaking through the ceiling—it shows power!
-
Traders see this as a signal to buy, expecting the stock to go higher.
2. Candlestick Patterns
What It Shows:
-
4 candlestick shapes used in charts:
-
Doji – Open and close prices are nearly the same. It looks like a plus sign.
-
Hammer – Short top, long bottom shadow. Looks like a hanging hammer.
-
Shooting Star – Long top, small body at bottom. Like a star falling.
-
Bullish Candle – Usually green: stock closed higher than it opened.
-
What It Means:
-
These are visual clues about what might happen next.
-
Doji: Market is confused—could go either way.
-
Hammer: Buyers may take over (bullish sign).
-
Shooting Star: Sellers might take over (bearish sign).
-
-
Traders use these to guess whether prices will rise or fall next.
Pattern |
What It Means |
What You Can Do |
|---|---|---|
Doji |
Market is undecided |
Wait for confirmation |
Hammer |
Reversal likely (bullish) |
Consider buying |
Shooting Star |
Reversal likely (bearish) |
Consider short-selling |
3. Risk-Reward Ratio
What It Shows:
-
A vertical bar divided into:
-
Red (Risk) – the amount you’re willing to lose.
-
Green (Reward) – your profit target.
-
-
The ratio is marked as 1:2.
What It Means:
-
For every ₹1 you risk losing, you’re aiming to make ₹2.
-
If you win just half your trades, you still make money in the long run.
-
It teaches smart risk-taking: don’t bet big just to win small.
-
If you have ₹10,000: never risk more than ₹200 in one trade.
-
Use the 1:2 risk-to-reward ratio: for every ₹1 you risk, aim to make ₹2.
Summary:
Concept |
What to Remember |
|---|---|
Breakout |
Price crosses above a ceiling → time to consider buying |
Candlestick |
Special patterns predict price moves |
Risk-Reward Ratio |
Only trade when the reward is worth the risk |
Pro Tips for Intraday Trading Success
-
Set Stop-Loss Orders: Always define a maximum loss you’re willing to take to protect your capital.
-
Manage Risk: Don’t risk more than 1-2% of your trading capital on a single trade.
-
Trade Liquid Stocks: Focus on stocks with high trading volumes for easier entry and exit.
-
Avoid Overtrading: Stick to your trading plan and avoid making impulsive trades.
-
Keep a Trading Journal: Record your trades to analyze and learn from your successes and mistakes.
Best Timeframes for Intraday Trading in India
Time Slot |
Market Behavior |
Strategy Recommendation |
|---|---|---|
9:15 AM – 10:30 AM |
High volatility |
Scalping, Breakouts |
10:30 AM – 1:30 PM |
Stable movement |
Moving Average, Range-bound trades |
1:30 PM – 3:15 PM |
Second round of volatility |
Reversals, Breakouts |
Pro Tip: Avoid trading in the last 15 minutes unless you’re experienced—it can be chaotic.
Intraday Trading Cheat Sheet
| Strategy | Best For | Key Indicators | Risk Level |
|---|
| Breakout | Trending Markets | Volume, Support/Resistance | Medium |
| Moving Average Crossover | Trend Identification | EMA (9-day, 21-day) | Low |
| Scalping | Quick Profits | Price Action, Volume | High |
| Gap and Go | Volatile Stocks | Opening Price Gaps, Volume | Medium |
| Reversal | Trend Reversals | Candlestick Patterns, RSI | High |
Common Mistakes Beginners Make (and How to Avoid Them)
-
Holding positions overnight in intraday
-
Following random tips without verifying
-
Trading without a stop-loss
-
Revenge trading after a loss
Remedy: “Trade like a robot, not like a gambler.”
Psychology of Trading: Winning the Mental Game
What is Trading Psychology?
Trading psychology refers to the thoughts, emotions, and behaviors that influence your trading decisions. Just like in cricket, a great batsman not only has skills but also mental discipline—trading works the same way.
Even the best strategies won’t work if your mind isn’t in the right place.
Common Psychological Traps in Trading (Explained with Real-Life Examples)
1. FOMO (Fear of Missing Out)
You see Nifty or a stock like Tata Motors shooting up quickly. Everyone on Twitter is shouting, “To the moon!”
You panic and buy without a plan.
Result: The stock reverses right after you buy. You feel frustrated.
Moral: FOMO = Jumping into trades late and impulsively. Instead, trade with logic, not emotions.
2. Revenge Trading
You made a loss in the morning on Infosys. You feel angry and immediately enter a new trade on ICICI Bank—without analysis—just to win back your money.
Result: You lose again. Now you’re even angrier.
Tip: Losses are part of trading. Learn from them—don’t chase them. Think like a scientist, not a gambler.
3. Overconfidence After Winning Streaks
You made 3 profitable trades in a row. Now you feel invincible. You increase your position size 5x in your next trade thinking: “I can’t lose now.”
Result: The trade goes wrong. You lose all your earlier profits in one go.
Pro Tip: Stay grounded. The market is bigger than anyone. Stick to your system, no matter how well you’re doing.
4. Fear of Pulling the Trigger (Analysis Paralysis)
You’ve analyzed HDFC stock all morning. The setup looks perfect. But you hesitate…
“What if it goes wrong?”
“Maybe I should wait more?”
“Is my analysis right?”
Result: The stock hits your predicted target—but you didn’t enter.
Lesson: Confidence comes from backtesting and practice. Trust your setup.
5. Impatience
You take a trade in Axis Bank. After 5 minutes, it’s not moving. You exit.
Ten minutes later, the stock jumps 2%—without you.
Result: Missed opportunity.
Tip: Let your trade breathe. Trust your stop-loss and target. Set alerts and avoid watching every tick.
Top Trading Tips to Win the Mental Game
Mindset Tip |
Why It Works |
|---|---|
Use a trading journal |
Helps identify patterns in wins/losses |
Follow a fixed routine |
Creates discipline and focus |
Accept losses gracefully |
Losses = tuition fees for learning |
Trade only when calm |
Never trade when angry, tired, or rushed |
Focus on process, not profit |
Let profits follow good habits |
Real-Life Case: Ramesh the Retail Trader
Ramesh is a 32-year-old intraday trader from Delhi.
He followed a breakout strategy. One day, he broke his rules and entered a trade too early, fearing he’d miss it.
He lost ₹5,000. Angry, he made two more impulsive trades and lost ₹12,000 more.
Next day, he took a break. He read his journal and realized:
-
He didn’t follow the strategy.
-
He didn’t wait for volume confirmation.
-
He didn’t use a stop-loss.
He decided to follow strict rules from then on. After a month, his win ratio improved, and so did his peace of mind.
Moral: Trading is 20% strategy, 80% psychology.
Daily Mental Routine for Traders
Morning (Before Market Open):
- Deep breathing or 5 mins meditation
- Check global cues/news
- Review your watchlist
- Remind yourself: “I will only trade when my setup appears.”
During Market:
- Follow your strategy
- Use stop-loss and target
- Avoid social media noise
After Market:
- Journal your trades
- What went right? What can improve?
- Walk away—refresh your mind
Even the best trading software or fastest chart can’t help if your emotions control your trades.
Master your mind, and you’ll start seeing better results—consistently.
“Amateurs trade with hope and fear. Pros trade with rules and discipline.”
Mini Practice Quizzes & Scenarios for Intraday Trading
(with answers and explanations at the end for learning!)
Quiz 1: Breakout Alert
Scenario:
Infosys has been trading between ₹1,400 and ₹1,450 for the past week. Today, it opens at ₹1,460 with high volume.
Question:
What should a trader consider doing?
A) Short sell Infosys
B) Wait for it to drop
C) Buy, as it may have broken out
D) Close the market
Quiz 2: Candle Clue
Scenario:
You see a Hammer candlestick at the bottom of a chart after 3 days of price decline in Reliance.
Question:
What could this mean?
A) Reliance is likely to keep falling
B) A bounce-back (reversal) may be coming
C) No signal
D) It’s the weekend
Quiz 3: Risk-Reward Ratio
Scenario:
You’re planning to enter a trade in HDFC at ₹1,000, with a stop-loss at ₹980 and a target at ₹1,040.
Question:
What is the risk-reward ratio?
A) 1:2
B) 1:1
C) 2:1
D) 1:4
Quiz 4: Position Sizing
Scenario:
You have ₹10,000 in capital. You only want to risk 2% per trade.
Question:
What is the maximum rupee loss you should allow for this trade?
A) ₹2,000
B) ₹200
C) ₹20
D) ₹1,000
Quiz 5: Volume Check
Scenario:
A stock breaks above resistance but volume is very low.
Question:
What should you do?
A) Buy immediately
B) Confirm with volume before trading
C) Short sell the stock
D) Call the CEO
Quiz 6: Reversal or Not?
Scenario:
You spot a Shooting Star pattern at the top of a rally in Tata Motors.
Question:
What could this pattern suggest?
A) Trend may reverse downward
B) More upside is expected
C) It’s a breakout
D) Time to go for lunch
Quiz 7: Best Trading Time
Scenario:
You’re trading in the Indian market.
Question:
Which of these time slots is usually the most volatile (i.e., prices move a lot)?
A) 12:30 PM – 1:00 PM
B) 9:15 AM – 10:30 AM
C) 2:45 PM – 3:30 PM
D) 10:00 PM – 11:00 PM
Quiz 8: Market or Limit?
Scenario:
You want to buy shares of TCS at exactly ₹3,000, not higher.
Question:
What order type should you place?
A) Market Order
B) Limit Order
C) Emergency Order
D) Discount Coupon
-
A market order is like telling the shopkeeper: “Give it to me now at the current price.”
-
A limit order is like saying: “I’ll only buy if you sell it at ₹95, not more.”
Why it matters: Helps beginners control buying/selling price more accurately.
Quiz 9: Stop-Loss Logic
Scenario:
You buy Axis Bank at ₹950. You set your stop-loss at ₹930.
Question:
What happens if the stock hits ₹930?
A) Your position sells automatically to limit your loss
B) You buy more shares
C) Nothing
D) The stock reverses magically
Quiz 10: Avoiding Overtrading
Scenario:
You lost two trades in a row and feel angry. You want to make back your losses quickly.
Question:
What’s the best move?
A) Trade again emotionally
B) Stop and review your trades
C) Increase trade size to recover faster
D) Guess randomly
Answers & Explanations
Quiz |
Answer |
Explanation |
|---|---|---|
1 |
C |
Price crossed resistance = breakout. |
2 |
B |
Hammer after a fall suggests reversal (bullish). |
3 |
A |
Risk: ₹20, Reward: ₹40 → 1:2 ratio. |
4 |
B |
2% of ₹10,000 = ₹200. |
5 |
B |
Low volume = weak breakout, wait for confirmation. |
6 |
A |
Shooting Star at the top = bearish reversal. |
7 |
B |
Market opens with volatility 9:15–10:30 AM. |
8 |
B |
Limit Order ensures you buy at ₹3,000 or lower. |
9 |
A |
Stop-loss exits trade to prevent further loss. |
10 |
B |
Emotional trading is risky—take a break and review. |
Conclusion
Intraday trading offers the potential for quick profits but requires discipline, strategy, and continuous learning. By understanding and applying the strategies outlined above, traders can navigate the Indian stock market more effectively. Remember, practice and patience are key to becoming a successful intraday trader.
Intraday trading is not a shortcut to wealth but a skill like chess or cricket. Practice, planning, and patience are your best teammates. If you keep your emotions in check and stick to strategies, the stock market can be a great teacher and even a rewarding friend.
Disclaimer: The information provided in this guide is for educational purposes only and should not be considered financial advice. Always conduct your own research or consult with a financial advisor before making trading decisions.