What Is the Stock Market & How It Really Works
The Real Beginning — The Money Game Nobody Taught Us
Imagine you’re sitting in your classroom.
Math period.
Your teacher writes on the board:
₹10,000 → ? (after 10 years)
and asks everyone what this will grow into if you just save it in your home locker.
Everyone guesses:
“₹10,000 only… maybe ₹11,000… maybe ₹12,000.”
Then she writes again:
₹10,000 → ₹31,058 (after 10 years at 12% yearly growth)
And the whole class is shocked.
“HOW?!”
This is exactly what the stock market does.
The stock market is NOT:
❌ Gambling
❌ A casino
❌ A shortcut to becoming rich
❌ A place where only ‘experts’ make money
It is simply a place where you become a tiny owner of India’s best companies.
If you invest in HDFC Bank, you become a tiny owner of HDFC Bank.
If you invest in TCS, you become a tiny owner of TCS.
If you invest in Reliance, you become a tiny owner of Reliance.
And when these companies grow, YOU grow.
🌱 What Exactly Is a Company?
Let’s imagine you and your friend start a lemonade stall at the school gate.
You need:
✅ Lemons
✅ Sugar
✅ Cups
✅ Ice
✅ A table
But you don’t have money.
So your three classmates give you:
-
Rahul: ₹300
-
Priya: ₹300
-
Ayesha: ₹400
Total ₹1,000 = your startup funding.
You say:
“Okay, I will give your money back and ALSO share the profit.”
That profit sharing = ownership.
You divide it into 10 parts (shares) of ₹100 each.
So your friends now own:
-
Rahul → 3 shares
-
Priya → 3 shares
-
Ayesha → 4 shares
These shares represent their ownership.
Now imagine the lemonade stand becomes super popular.
You earn great profits.
Suddenly each share becomes worth ₹150.
Rahul bought 3 shares for ₹300.
Now those are worth ₹450.
This is the stock market — ownership and growth.
🏛️ What Is the Stock Market Really? (And Why It Exists)
The stock market exists for two reasons:
✅ 1. Companies Need Money
Big companies raise money from the public instead of only borrowing from banks.
This is done through:
-
FPOs (Follow-on Public Offerings)
✅ 2. People Need a Place to Grow Their Money
Instead of keeping money in a locker or bank at low interest, you can:
✅ Grow with businesses
✅ Earn from compounding
✅ Build wealth
✅ Beat inflation
It’s a win-win.
🔄 The Full System in One Simple Diagram
Here’s how everything flows:
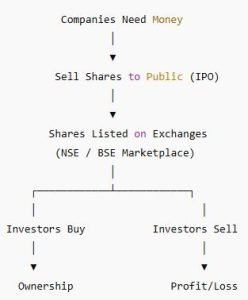
You are basically participating in the growth engine of the country.
🧠 Trading vs Investing — The REAL Difference
🎯 Investing: The Long-Term Student
Imagine you plant a mango tree.
You water it daily.
It doesn’t grow much in 2 weeks.
It doesn’t grow much in 2 months.
But in 5 years — it becomes massive, gives shade, gives fruits.
That’s investing.
You buy good companies.
You hold them.
You let them grow.
⚡ Trading: The Short-Term Gamer
Trading is like playing cricket highlights — fast, exciting, quick.
Buy at ₹100
Sell at ₹103
Profit ₹3 per share
Exit
Done
Trading depends on:
-
Price movement
-
Timing
-
Charts
-
Patterns
It’s a skill game.
Not luck.
Not magic.
Not gambling.
But it needs:
✅ Risk control
✅ Discipline
✅ Patience
✅ Experience
🔍 Which One Should a Beginner Choose?
(Explained very honestly)
✅ If you’re a complete beginner:
Start with investing.
✅ If you’re curious about trading:
Learn slowly.
Trade tiny amounts.
Never trade without stop-loss.
Avoid F&O initially.
✅ The best approach:
Be 90% investor
and
10% learner trader
That’s the safest path.
📈 How Compounding Actually Works (Simple Explanation)
Most people misunderstand compounding.
Let’s break it down with a Class-10 level example.
Imagine:
You invest ₹5,000 every month
for 10 years
at 12% yearly return
Your total investment = ₹6,00,000
Your maturity amount ≈ ₹11.6 lakh
You earned ₹5.6 lakh without doing anything.
Look at the appreciation:
Most money comes in the later years.
That’s compounding.
What You Need to Start (Only Four Things)
Here are the four items:
That’s all.
You don’t need:
❌ Office visit
❌ Paperwork
❌ Cheque book
❌ Salary slip
❌ High income
❌ Experience
In India, opening a Demat account is completely online and takes 10 minutes.
📦Understanding the Three Core Accounts
✅ 1. Bank Account
Your money lives here.
✅ 2. Trading Account
You place BUY/SELL orders from here.
✅ 3. Demat Account
Your shares stay safe here.
Here’s the simple diagram:
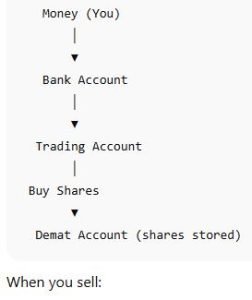
Demat → Trading → Bank
✨ PART 1 Summary
✅ Now you understand:
✔ What is a company
✔ Why stock markets exist
✔ What is ownership
✔ How investing works
✔ How trading works
✔ Difference between the two
✔ Compounding
✔ What documents you need
✔ How Bank → Trading → Demat flow works
Next, we move to:
✅ PART 2 : Opening the Demat Account, Choosing Broker, KYC, Safety, Charges, Recommended Broker Section
✅Opening Your Demat & Trading Account (The Real A–Z Guide for Indian Beginners)
⭐ What Exactly Is a Broker?
Imagine a big supermarket.
Inside the supermarket:
-
You pick stuff
-
You put it in your cart
-
You go to the counter
-
They scan items
-
You pay
-
You get your items
Now imagine stocks instead of groceries.
NSE/BSE = The giant supermarket
Brokers = The counters
Trading app = Your shopping cart
Demat account = Your bag
You can’t directly walk into NSE or BSE and start buying.
You need a broker, who connects YOU to the stock exchange.
Brokers are like:
✅ Delivery agents
✅ Cashiers
✅ Software providers
✅ Custodians
✅ Middlemen between you and the exchange
But unlike your grocery store cashier, brokers are regulated by SEBI and exchanges.
⭐ Broker Types in India (Detailed Breakdown)
There are TWO kinds of brokers:
✅ 1. Discount Brokers
Like:
They offer:
✅ Low brokerage fees
✅ Clean, simple apps
✅ No research reports usually
✅ Fast account opening
✅ Good for beginners
✅ Great for traders and investors
Think of them as affordable online classrooms.
✅ 2. Full-Service Brokers
Like:
-
Kotak Securities
-
HDFC Securities
They offer:
✅ Research reports
✅ Relationship managers
✅ Higher charges
✅ Older, traditional systems
Think of them like private tuitions — more expensive, more hand-holding.
⭐ How to Choose the Best Broker (The Real Factors That Actually Matter)
Most beginners choose brokers based on:
❌ YouTube ads
❌ Famous faces
❌ Random Telegram opinions
This is wrong.
Here’s the REAL list that matters.
✅ Factor 1: Brokerage Charges
Brokerage = fee charged per trade.
In India:
-
Most brokers charge zero brokerage for delivery
-
Intraday & F&O = small charges (₹10–₹20 per order)
This matters because brokerage directly affects profits.
✅ Factor 2: DP Charges
DP = Depository Participant.
DP charges apply when you sell shares in delivery.
Usually ₹13.5–₹20 per scrip.
Some brokers absorb it.
Some charge more.
✅ Factor 3: Account Opening & AMC
Account opening:
-
Mostly free nowadays
AMC (Annual Maintenance Charge):
-
Some brokers = ₹0
-
Some charge ₹300–₹500 per year
-
Some charge only if inactive
✅ Factor 4: App Stability
You need:
✅ App that doesn’t crash on volatile days
✅ Fast order execution
✅ Simple UI
✅ Good charts
Few things are more painful than:
💀 Press BUY → App hangs
💀 Press SELL → Order rejected
💀 SL not triggered because of lag
This is where the top brokers shine.
✅ Factor 5: Safety & Regulations
BROKER SAFETY IS THE MOST IMPORTANT.
Your broker must:
✅ Be registered with SEBI
✅ Be a member of NSE & BSE
✅ Be connected to CDSL or NSDL
✅ Follow the pledge/re-pledge norm (introduced after Karvy scam)
✅ Have separate client funds & broker funds
✅ Show CDSL TPIN & OTP before share selling
⭐ Behind the Scenes — What Happens When You Click “BUY”
Most beginners think:
Buy → Order placed → Done
But here’s the actual process:
You Press BUY
│
▼
Order sent to Broker
│
▼
Broker sends to Exchange (NSE/BSE)
│
▼
Matching Engine tries to find Seller
│
▼
Trade Executed (Matched)
│
▼
Confirmation sent back to Broker
│
▼
Shares go to Your Demat (T+1)
When you sell, the opposite process happens.
⭐ Depository System — CDSL & NSDL
Think of CDSL/NSDL as India’s digital lockers for shares.
Your broker DOES NOT hold your shares.
They only provide an interface.
Your shares are actually stored with:
✅ CDSL (preferred)
or
✅ NSDL
If Zerodha closes tomorrow → your shares still stay safe
If Upstox shuts down → your shares still stay safe
If Groww disappears → your shares still stay safe
Because they live in CDSL/NSDL, not inside the broker.
This is the biggest security of the Indian markets.
⭐ Step-by-Step Demat Account Opening (FULL WALKTHROUGH)
Let’s now go step-by-step.
✅ STEP 1 — Mobile Number + Email Verification
You enter:
-
Mobile
-
Email
You receive 2 OTPs.
This ensures:
✅ Your identity
✅ Your contact channels
✅ Spam prevention
✅ STEP 2 — PAN Verification
You enter:
-
PAN number
-
DOB
System pulls your data from the Income Tax database.
Why PAN?
✅ PAN = unique identity for all financial transactions
✅ SEBI requires it
✅ Brokers need it for tax reporting
✅ STEP 3 — Aadhaar + eKYC
Two types:
✅ 1. Aadhaar OTP-based eKYC
Fastest
100% online
Most common
✅ 2. Offline DigiLocker eKYC
Used when mobile not linked
Documents uploaded manually
Your Aadhaar verifies:
✅ Name
✅ Address
✅ DOB
✅ Identity
✅ STEP 4 — Bank Account Linking
You upload:
-
Bank statement / passbook
-
Cancelled cheque (not mandatory in many brokers)
Why this matters:
✅ Withdrawals go ONLY to this bank
✅ Safety (prevents fraud)
This prevents someone from:
❌ Depositing from stolen accounts
❌ Withdrawing to someone else’s bank
✅ STEP 5 — Signature Upload
You sign on white paper and upload.
Why?
✅ Prevents fake usage of your account
✅ Matches your legal identity
✅ Required for eSign agreements
✅ STEP 6 — IPV (In-Person Verification)
You record a short video.
Typical instructions:
-
Say your name
-
Show your PAN
-
Look into camera
-
Blink
-
Move head slightly
This ensures you’re a real person.
✅ STEP 7 — eSign via Aadhaar
You will sign:
-
Demat form
-
Trading agreement
-
Rights & obligations
-
Risk disclosure documents
All via Aadhaar OTP.
✅ STEP 8 — Activation
Usually within:
- Same day for most brokers
You will receive:
✅ Login ID
✅ Password
✅ CDSL TPIN
CDSL TPIN is used whenever you SELL shares — for safety.
⭐ Comparison Table — India’s Top Brokers
Here is a detailed comparison
Feature |
|||||
|---|---|---|---|---|---|
Brokerage |
₹20/order |
₹20 |
₹20 |
₹20 |
₹20 or 0.05% |
Account Opening |
Free |
Free |
Paid (₹200) |
Free |
Free |
TradingView Integration |
✅ Native |
⚙️ Partial |
❌ |
✅ Built-in |
❌ |
API Access |
✅ Free |
Paid |
Paid |
Free |
❌ |
Options Strategy Builder |
✅ Advanced |
Limited |
❌ |
✅ Basic |
❌ |
Speed |
⚡ Ultra-fast |
Fast |
Moderate |
Fast |
Average |
Margin (MTF) |
✅ 4× |
✅ 4× |
❌ |
✅ 4× |
❌ |
Verdict:
Dhan beats most brokers on speed, tech, and trader tools — especially for intraday and options trading.
-
Visit https://dhan.co
-
Click “Open Free Account”
-
Upload PAN, Aadhaar & bank details
-
Complete eSign using Aadhaar OTP
-
Start trading instantly (no paperwork)
💥: Open Free Dhan Account Now – 100% online in under 5 minutes.
⭐ Safety Rules You MUST Know Before Using a Broker
Let’s make this extremely simple.
✅ Rule 1 — Never Share Your CDSL TPIN
This is the PIN used to sell shares.
If someone gets it, they can sell your holdings.
✅ Rule 2 — Always Use 2FA Login
Use:
✅ PIN
✅ Biometric
✅ App passcode
✅ Rule 3 — Never Allow Remote Access to Anyone
NEVER use:
❌ AnyDesk
❌ TeamViewer
This is how 90% of frauds happen.
✅ Rule 4 — Your Money & Shares Are Safe Even if Broker Shuts Down
Why?
Because:
✅ Shares = in CDSL/NSDL
✅ Funds = kept in segregated accounts
✅ SEBI monitors everything
✅ Rule 5 — Check Broker Complaints Before Choosing
Visit:
-
NSE website
-
BSE website
-
SEBI SCORES
-
Google Play Store ratings
Check for:
✅ App freeze
✅ Withdrawal delays
✅ Repeated technical issues
⭐ A Visual Flowchart — Entire Demat + Trading System
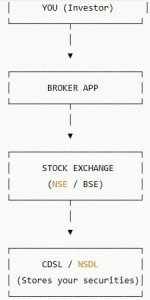
You now deeply understand:
✔ Brokers
✔ Regulations
✔ Safety
✔ CDSL/NSDL
✔ KYC
✔ Account opening
✔ Behind-the-scenes execution
✔ Full tables
✔ Mid-article recommended broker section
Next, we move to:
✅ PART 3 — Order Types, Charges, Product Types, Your First Trade
✅ Order Types, Product Types, Charges & Your First Real Trade (The Most Important Beginner Chapter)
⭐Before You Place Your First Trade — Understand “How Prices Move”
Before learning buttons like:
-
Market
-
Limit
-
Stop loss
-
CNC
-
MIS
…you must understand why prices change, otherwise you will always be confused.
✅ Why do stock prices go up or down?
Simple:
Price goes UP when buyers are more aggressive than sellers.
Price goes DOWN when sellers are more aggressive than buyers.
It’s not magic. It’s not luck.
It’s just demand and supply.
Imagine:
-
You want to buy a cricket bat.
-
The shop has 5 bats.
-
Suddenly 10 people want the same bat.
-
Shopkeeper increases price.
Same thing happens with stocks.
⭐ What Is a Candle? (The Building Block of Trading Charts)
Whenever you see a chart in any app, you see candles.
They look like this:
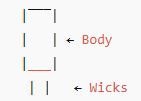
Let’s break it down in Class-10 English:
✅ 1. The “body”
Shows price movement from opening to closing.
✅ 2. The “wick/shadow”
Shows highest & lowest price in that period.
✅ 3. Green candle = price went UP
✅ 4. Red candle = price went DOWN
That’s it.
A red candle doesn’t mean a company is dying.
A green candle doesn’t mean a company is becoming a unicorn.
It’s simply buyers vs sellers.
⭐ Two Major Types of Market Participants
(You need to know this before placing orders)
There are only two types of people in markets:
✅ Investors → Slow, long-term
✅ Traders → Fast, short-term
Investors don’t care if today’s candle is red or green.
Traders care deeply.
Because traders earn from movement, not holding.
⭐ Order Types Explained Like You’re in School
Let’s dive into the heart of placing orders.
Most apps show:
✅ Market
✅ Limit
✅ Stop-loss
✅ SL-M
✅ GTT
✅ AMO
Let’s break each one down like a story.
✅ 1) MARKET ORDER (The “Buy Right Now” Button)
A Market Order means:
“Buy/sell at the best available price right now.”
Example:
You want to buy Reliance.
Current price: ₹2,400
You press:
✅ Buy
✅ Quantity: 1
✅ Market Order
✅ Confirm
The order executes instantly.
But maybe you get:
-
₹2,401
-
₹2,399
-
₹2,402
Why?
Because prices are constantly moving.
✅ Use Market Order ONLY when:
-
The stock is liquid (big companies)
-
You want an immediate entry
-
Small quantity
❌ Do NOT use Market Order when:
-
The stock is low-volume
-
You want control over price
-
You are trading options (big danger)
✅ 2) LIMIT ORDER (The “Buy at EXACT Price You Want” Button)
Limit order means:
“I want to buy only at X price or better.”
Example:
Stock is ₹100.
You think a fair price is ₹98.
You place:
✅ Limit Order at ₹98.
If price drops → Your order gets executed.
If price doesn’t drop → No trade.
This is the safest type for beginners.
✅ 3) STOP LOSS (SL) — Your Safety Seatbelt
If you drive a car, you wear a seatbelt.
You don’t wear it because you expect an accident —
You wear it because IF something happens, you’re protected.
Stop-loss does the same for trading.
✅ Example:
You bought Infosys at ₹1,500.
You want to risk only ₹50 per share.
Set SL at ₹1,450.
If price touches ₹1,450 → Auto-sell → You are safe.
Without SL:
Stock could fall to ₹1,300… ₹1,200… ₹1,000…
This is how most beginners lose money.
✅ 4) SL-M (Stop-loss Market)
SL-M = Stop-loss MARKET.
Means:
“If the price hits my SL, sell at market price.”
This ensures execution.
Good for stocks with enough liquidity.
✅ 5) GTT (Good Till Triggered)
Think of GTT as:
“A standing instruction for months.”
Example:
ITC is at ₹470.
You want to buy only if it drops to ₹420.
Set a GTT BUY at ₹420.
If stock touches 420 anytime in coming months → Order triggers.
Same for selling.
GTT is like:
✅ Reminder
✅ Auto-trader
✅ Wish-list with conditions
✅ 6) AMO (After Market Order)
Used to place orders when markets are CLOSED.
Market closes at 3:30 PM.
At 8 PM you realize:
“I want to buy TCS tomorrow morning at ₹3,500.”
Place:
✅ After Market Order (AMO)
✅ Limit price: ₹3,500
✅ Quantity: 1
It will be executed next morning after 9:15 AM.
Useful for people with jobs or school.
⭐ Product Types — CNC, MIS, NRML (The Real Meaning)
Every time you buy, your app asks:
-
CNC
-
MIS
-
NRML
-
CO/BO
Let’s explode the confusion.
✅ 1) CNC — Cash & Carry (Long-term Investing Mode)
CNC means:
✅ You are buying the share
✅ It moves to your Demat
✅ You can hold it for years
✅ No auto-square off
✅ No leverage
If you are an investor → ALWAYS select CNC.
✅ 2) MIS — Margin Intraday Square-Off
MIS means:
✅ Buy/sell for intraday only
✅ Auto square-off around 3:20 PM
✅ Slight leverage
✅ High risk
✅ Not for beginners
Imagine:
You buy at 9:30 AM
Price moves till 3 PM
But your MIS position MUST be closed today.
This is like borrowing a pencil from your friend:
“I’ll return it before school ends.”
✅ 3) NRML — Overnight F&O Trades
NRML is used when:
✅ You trade Futures
✅ You SELL options (writing)
✅ You want to hold position overnight
✅ You have enough margin
Beginners → IGNORE NRML.
Futures & Options are extremely risky if you don’t know what you’re doing.
⭐ Understanding Charges (FULL Breakdown)
This is where most blogs give short bullet points.
We will explain every charge like a teacher explaining a Math’s word problem.
Charges apply on every buy/sell.
Let’s say you buy:
1 share of Infosys @ ₹1,500
Let’s break the charges:
✅ 1) Brokerage
Fee taken by broker.
For Delivery (CNC):
✅ Most brokers: ₹0
For Intraday or F&O:
✅ ₹20/order (flat)
✅ 2) STT (Security Transaction Tax)
Government tax.
-
On equity delivery BUY: 0.1%
-
On equity delivery SELL: 0.1%
STT is the cost of investing in India.
✅ 3) Exchange Transaction Charges
NSE/BSE charge tiny fee per trade.
Very small, but compulsory.
✅ 4) GST
18% on brokerage + exchange charges.
NOT on entire trade.
✅ 5) Stamp Duty
State-level tax.
Tiny.
✅ 6) DP Charges
This is important:
✅ DP charges apply ONLY WHEN SELLING shares in CNC.
✅ Around ₹13.5–₹20 per scrip.
If you sell 5 stocks in same company → only 1 DP charge applies.
⭐ A FULL TRADE EXAMPLE (with Real Numbers)
Let’s say:
✅ You buy 10 shares of ITC at ₹450
✅ Total = ₹4,500
Charges:
-
Brokerage: ₹0
-
STT: ₹4.50
-
Exchange: ₹0.30 (approx)
-
GST: ₹0.05
-
Stamp duty: ₹0.10
Total charges ≈ ₹4.95
If you SELL at ₹460:
-
Profit per share = ₹10
-
Total profit = ₹100
-
Charges = ₹4–₹8
-
DP Charge = ~₹15
-
Net Profit ≈ ₹77–₹81
This is realistic.
⭐Step-by-Step — Your First Trade as a Beginner
Let’s walk you through EXACTLY what you will see in the app.
✅ Step 1: Search the Stock
You type “HDFC Bank”.
You see:
-
Chart
-
Price
-
Buy/Sell
-
Market depth
✅ Step 2: Click BUY
App shows:
-
Market / Limit
-
CNC / MIS
-
Quantity
-
Trigger price (if using SL)
✅ Step 3: Choose CNC
Because you want to invest.
✅ Step 4: Choose LIMIT
Set your price, e.g. ₹1,480.
✅ Step 5: Confirm
Order goes to exchange.
✅ Step 6: Execution
If price drops to ₹1,480:
✅ Your order fills
✅ Shares show in “Positions”
✅ Next day it moves to “Holdings”
⭐ Market Depth — Understanding Buyers & Sellers
Market depth looks like this:
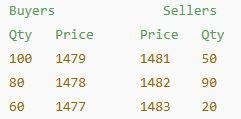
This shows:
✅ Where buyers want to buy
✅ Where sellers want to sell
Useful for:
✅ Intraday
✅ Scalping
✅ High-speed trading
Not important for long-term investing.
⭐ FULL ASCII Flow — Your First Buy
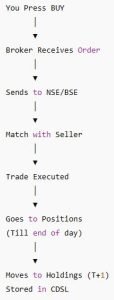
Beautiful system, fully regulated.
You now fully understand:
✔ Order types
✔ CNC, MIS, NRML
✔ Charges
✔ Your first trade
✔ Market depth
✔ Charts & candles
✔ Example trades
✅ PART 4 (Next): All Products — Stocks, ETFs, Mutual Funds, IPOs, Bonds, SGBs, Gilt Funds, F&O
✅ All Investment & Trading Products in India
⭐ The Big Picture — What Can You Actually Buy in the Indian Market?
Think of the stock market like a giant shopping mall.
Inside it, you have:
✅ Stocks (shares of companies)
✅ ETFs
✅ Mutual Funds
✅ IPO Shares
✅ Gold Bonds
✅ Government Bonds
✅ Corporate Bonds
✅ Treasury Bills
✅ REITs & INVITs
✅ Derivatives (Futures & Options)
Most beginners only know about “shares”.
But the Indian market is WAY bigger.
This chapter will explain each item in this mall, using stories, examples, visuals, tables.
⭐ STOCKS — Owning a Piece of a Company
Let’s start with the simplest word:
Stock = A tiny part of a company.
Owning 1 share of Reliance means:
You own 1 small piece of Reliance Industries Ltd.
Even Mukesh Ambani cannot stop you from attending AGM (yes, it’s true).
✅ Why do stock prices go up?
Because the company grows.
That growth comes from:
-
Increasing profits
-
New products
-
Expansion
-
New customers
-
Better management
-
Strong economy
Stocks follow businesses, not magic.
✅ Why do stock prices fall?
Because:
-
Company performs badly
-
India’s economy slows
-
Global markets crash
-
News/panic
-
Poor results
-
Scams
✅ Types of stocks (explained simply)
Here’s a clean table:
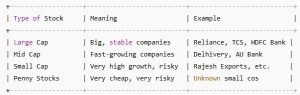
Beginners should stick to Large caps and Index ETFs.
✅ How to buy your first stock
Example:
You want to buy 1 share of ITC.
Steps:
-
Search “ITC” in your broker app
-
Check the chart
-
Press BUY
-
Select CNC (long-term)
-
Select LIMIT
-
Enter quantity: 1
-
Enter price: e.g. 450
-
Confirm
Congratulations — you now own a part of ITC.
⭐ ETFs — The “Smart Basket” of Investing
Think of ETFs as:
One share that contains MANY companies.
Example:
Nifty 50 ETF includes 50 of India’s top companies.
You buy one ETF unit → You automatically own parts of 50 companies.
✅ Why ETFs are perfect for beginners
✅ No need to pick stocks
✅ Low risk
✅ Low fees
✅ Highly diversified
✅ Recommended globally
✅ Easy to understand
✅ Popular ETFs in India

✅ Example: Buying a Nifty 50 ETF
Suppose Nifty 50 ETF = ₹220.
You buy 10 units = ₹2,200.
Inside this one ETF unit, you get exposure to:
-
Reliance
-
Infosys
-
HDFC Bank
-
ICICI Bank
-
TCS
-
Asian Paints
-
HUL
-
ITC
-
And 42 more
Instant diversification.
⭐ Mutual Funds — The “Investment Tiffin Box” Made by Experts
Mutual Funds are like:
“Give your money to a professional cook who prepares a healthy meal.”
In mutual funds:
-
Thousands of people invest
-
Money is pooled
-
A fund manager picks stocks/bonds
-
You get units of the fund
✅ Types of Mutual Funds (Super Simple Chart)
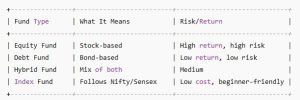
✅ SIP — Systematic Investment Plan
SIP = Monthly auto-deduction.
Example:
You invest ₹1,000 every month in a Nifty index fund.
After 10 years → approx ₹2.3–2.5 lakh
After 20 years → approx ₹10–12 lakh
SIPs are the superpower of Indian middle class investing.
✅ Mutual Fund vs ETF (Comparison)
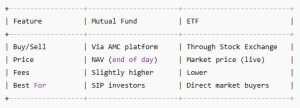
⭐ IPO — The Company’s First Day in the Stock Market
IPO = Initial Public Offering
First time a company sells shares to the public.
Example:
Zomato IPO, Nykaa IPO, Paytm IPO, LIC IPO.
Companies raise money.
Investors try to buy early.
✅ How to Apply for an IPO (Real Steps)
Using UPI:
-
Go to your broker
-
Open IPO section
-
Select IPO (e.g., LIC)
-
Enter lot size
-
Enter UPI ID
-
Approve mandate on your UPI app
-
Wait for allotment
If allotted → Shares credited to Demat
If not → Money released
✅ Should beginners apply for IPOs?
Not always.
Reason:
New stocks can crash quickly (Paytm fell 70%).
Only apply for:
✅ Profitable companies
✅ Strong brand
✅ Reasonable valuations
⭐ Government Securities (G-Secs), T-Bills & Bonds — The Safe Side of Investing
Think of bonds as loans you give to the government or companies.
Government says:
“You give us money today, we will give you interest and return your money on maturity.”
This is one of the safest ways to invest.
✅ Types of Govt Securities
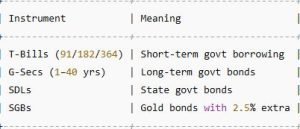
✅ Buying Government Bonds through Broker
You can buy:
✅ SDLs
✅ T-Bills
✅ G-Secs
✅ SGBs
Directly on your trading app through:
-
NSE GoBID
-
Broker order window
-
RBI Retail Direct (direct government platform)
⭐ SGBs — Sovereign Gold Bonds (The BEST Way to Buy Gold)
SGB = Gold investment + 2.5% extra interest.
Better than:
-
Gold jewellery
-
Digital gold
-
Gold ETF
Why?
✅ No making charges
✅ No storage problem
✅ Guaranteed by Indian Govt
✅ 2.5% interest yearly
✅ Tax-free profit after 8 years
Example:
You buy 10g SGB @ ₹6,000 each → ₹60,000.
Every year you get:
₹60,000 × 2.5% = ₹1,500 interest.
Plus gold value appreciation.
⭐ REITs & INVITs — Real Estate for Students & Small Investors
REIT = Real Estate Investment Trust
INVIT = Infrastructure Investment Trust
These allow you to earn rent-like income without buying property.
Example REITs:
-
Embassy REIT
-
Mindspace REIT
-
Brookfield REIT
Example INVITs:
-
PowerGrid INVIT
-
IRB INVIT
✅ Benefits
✅ Low entry amount (₹300–₹500)
✅ Regular payouts
✅ Diversification
✅ Better than buying flats on loan
⭐ F&O (Futures & Options) — The Simplest Explanation Ever
Most “gurus” make F&O sound too complex.
Let’s make it child-level.
✅ Futures (Explained using a Mango Story)
Suppose:
Mangoes cost ₹100/kg today.
You think prices will go up next month.
You make a deal with a shopkeeper:
“You will sell me mangoes after 1 month at ₹100/kg no matter what.”
This is a future contract.
If price becomes ₹150/kg → You profit.
If price becomes ₹60/kg → You lose.
✅ You must honor the contract.
✅ Profits/losses settle daily.
✅ Options (Explained like buying a movie ticket)
Imagine:
You book a movie ticket refundable for ₹20 extra.
You pay:
✅ ₹20 for the option to cancel
✅ Not the full ticket price
This ₹20 is like options premium.
If you want, you can use the ticket.
If not, you lose only ₹20.
OPTIONS = Right, not obligation.
✅ Two types of options:
-
Call Option → Right to buy
-
Put Option → Right to sell
✅ THE GOLDEN WARNING
F&O is NOT for beginners.
Why?
Because:
❌ Leverage
❌ High speed
❌ Fast losses
❌ Emotional pressure
❌ No guaranteed profit
Start with:
✅ Stocks
✅ Index funds
✅ ETFs
Then later, slowly learn F&O.
⭐ All Investments Compared (Beginner Friendly)
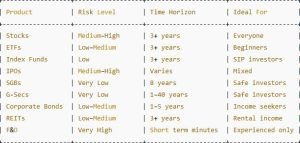
⭐ A Beginner’s Product Map — What You Should Buy First
Imagine this flowchart printed on your wall:
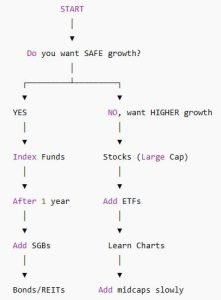
For now:
✅ Start with Index Funds (SIP)
✅ Buy 1-share of top companies
✅ Learn gradually
✅ Avoid F&O
✅ PART 5: Taxes, Risk Management, Psychology, Asset Allocation
It will cover:
✅ STCG / LTCG explained simply
✅ F&O taxation explained easily
✅ Examples with numbers
✅ Risk rules
✅ 1% rule explained
✅ Position sizing formula
✅ Fear, FOMO, biases
✅ Long-term allocation
✅ Crash survival system
✅ Taxes, Risk Management, Psychology & Asset Allocation (The Chapter That Saves Beginners From Losing Money)
⭐ TAXES — Explained So Simply Even a 10th Grader Can Understand
Most adults don’t understand taxes.
This chapter fixes that permanently.
Taxes apply on:
✅ Selling shares
✅ Selling mutual funds
✅ Selling ETFs
✅ Selling bonds (sometimes)
✅ F&O profits
✅ Dividends
Let’s break ALL of this down using stories, tables, and simple maths.
✅ Capital Gains Tax (When You Sell Shares)
Imagine you buy:
-
10 shares of Infosys at ₹1,500
-
Total cost = ₹15,000
After 8 months, you sell at ₹1,600.
Your profit = ₹1,000.
This profit is called capital gains.
But the tax depends on holding period.
Let’s simplify:
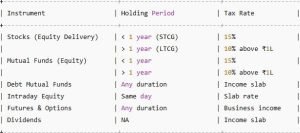
✅ If you hold STOCKS for LESS than 1 year → STCG
STCG = Short Term Capital Gains
Tax = 15% flat
Example:
Profit = ₹1,000
Tax = ₹150
Your net = ₹850
✅ If you hold STOCKS for MORE than 1 year → LTCG
LTCG = Long Term Capital Gains
Tax = 10% on profit above ₹1,00,000
Example:
You invested in ITC for 3 years:
-
Profit = ₹1,20,000
-
Tax-free limit = ₹1,00,000
-
Taxable = ₹20,000
-
Tax = ₹2,000
Your net = ₹1,18,000.
✅ Tax on Mutual Funds
Same rule as stocks IF they are equity funds.
Equity mutual funds include:
-
Large cap
-
Mid cap
-
Flexi cap
-
Index funds
-
ELSS
Tax:
✅ Less than 1 year → 15%
✅ More than 1 year → 10% beyond 1 lakh
✅ Tax on Debt Mutual Funds
Debt funds include:
-
Liquid
-
Corporate bond
-
Government bond
-
Money market funds
Here:
✅ Gains are added to your income
✅ Taxed as per your income slab
Simple.
✅ Dividend Tax (Important Update)
Dividends are:
✅ Added to your income
✅ Taxed as per your tax slab (5%, 20%, 30%)
Example:
Your dividend from ITC = ₹1,000
Your tax slab = 10%
Tax = ₹100
You keep = ₹900
⭐ F&O TAXATION (Made Stupidly Simple)
This is where most websites overcomplicate things.
Let me simplify to school level.
✅ FUTURES
Profits from Futures = Business Income
Losses = Business Loss
✅ Can be set off
✅ Can be carried forward for 8 years
✅ OPTIONS
There are two sides:
Options BUYERS pay tax on final profit.
Options SELLERS have complex adjustments, but beginners should not sell options anyway.
✅ Do beginners need audit?
Only if:
✅ Your turnover crosses certain limits
✅ OR you have losses & want to carry forward
But 90% of new investors don’t need audit.
⭐ TAX TABLE — Simple Summary
⭐ RISK MANAGEMENT — The Real Holy Geeta of Trading
If every beginner followed this chapter,
80% of losses would disappear.
Let’s break it down into 5 core parts:
✅ Position sizing
✅ Stop loss
✅ Risk-reward ratio
✅ Maximum daily loss
✅ Capital safety rules
⭐ POSITION SIZING — The Formula That Protects You
This one formula can save beginners ₹50,000–₹5,00,000 in losses.
Formula:
Let’s say:
-
Capital = ₹10,000
-
You risk = 1% per trade = ₹100
-
Stop loss = ₹5 (distance between entry & SL)
Then:
You buy 20 shares, NOT 100.
This is how professional traders operate.
⭐ WHAT IS STOP LOSS REALLY? (Story Version)
You are at the fair.
There’s a ride called “The Risky Drop”.
It looks exciting.
You get on.
But there’s a seatbelt.
Why?
Because rides can malfunction.
The seatbelt doesn’t stop the ride.
It only protects you if something goes wrong.
Stop loss is that seatbelt.
Example:
You buy HDFC Bank at 1,500.
Your SL = 1,470.
If price falls ⇒ you exit safely.
If price rises ⇒ you ride the wave.
Stop-loss protects your capital
so you can trade again tomorrow.
⭐ RISK–REWARD RATIO — How Much You Can Earn vs Lose
Ideal ratio = 1 : 2 or 1 : 3
Meaning:
If you risk ₹100,
You aim to earn ₹200–₹300.
Why?
Because even if you lose 50% of trades,
you still make money.
Example:
5 winning trades (profit ₹500 each) = ₹2,500
5 losing trades (loss ₹200 each) = ₹1,000
Net profit = ₹1,500
This is how professionals win consistently.
⭐ MAX DAILY LOSS RULE — Prevent Anti-Destruction Mode
Set a rule:
✅ If you lose 2% of total capital in a day → STOP
If you continue trading after a big loss,
you will trade emotionally.
Emotion = disaster.
This rule prevents revenge trading.
⭐ CAPITAL SAFETY RULES (Every Beginner Must Tattoo These Mentally)
✅ Never put more than 10% of money in one stock
✅ Never invest money you need within 1 year
✅ Do not borrow money to trade
✅ Do not use leverage until 12 months of experience
✅ Avoid penny stocks
✅ Avoid F&O for first 1–2 years
✅ Avoid tip groups, WhatsApp signals, Telegram gurus
These rules protect you from major damage.
⭐ PSYCHOLOGY — The Real Boss of Stock Market
The market doesn’t defeat beginners.
Their own emotions defeat them.
The four deadly enemies are:
✅ Fear
✅ Greed
✅ FOMO
✅ Revenge trading
Let’s break them down in stories.
✅FEAR (The Fear of Losing Money)
When your stock falls from ₹100 to ₹95,
you panic.
You sell.
Then price goes to ₹120.
Solution:
✅ Use stop-loss
✅ Know why you bought
✅ Trust your plan
✅ Don’t watch charts every second
✅ GREED (The “I Want More” Syndrome)
You buy at ₹100.
Price hits ₹115.
You want ₹130.
It goes back to ₹100.
You lose.
Solution:
✅ Take profits at target
✅ Follow 1:2 rule
✅ Never break your plan
✅ FOMO (Fear Of Missing Out)
News: “Adani stock up 20% today!”
You buy the next day.
Stock falls 10%.
You regret.
Solution:
✅ Avoid impulsive trades
✅ Avoid hype
✅ Trade with reason, not excitement
✅ REVENGE TRADING (The Worst Emotion)
You lose ₹500.
You get angry.
You want to recover it immediately.
You take random trades.
You lose more.
Solution:
✅ Stop after 2% daily loss
✅ Walk away
✅ Return next day with fresh mind
⭐ ASSET ALLOCATION — The Smart Way to Divide Your Money
This determines your long-term success more than stock picking.
Let’s break it down like a school timetable.
✅ The 60–30–10 Model (Perfect for Ages 15–30)
✅ Why this works:
✅ Enough growth
✅ Enough safety
✅ Enough liquidity
✅ Prevents big losses
✅ Allows compounding
✅ Simple Allocation Example for ₹10,000/month
✅ ₹6,000 in Nifty 50 Index Fund
✅ ₹3,000 into SGB/Bond fund
✅ ₹1,000 emergency fund
✅ 1. DO NOT panic sell
In every crash,
people who sell in panic regret later.
✅ 2. Continue SIPs
This is where the real wealth is created.
During dips:
✅ Same amount
✅ More units
✅ Higher long-term profit
✅ 3. Keep emergency fund separate
Never invest money needed for rent, school fees, food, etc.
✅ 4. Avoid checking charts every hour
It increases anxiety.
✅ 5. Buy gradually (not all at once)
Use 4-part buying:
✅ Part 1: -5%
✅ Part 2: -10%
✅ Part 3: -15%
✅ Part 4: -20%
This lowers your average.
⭐ Golden Rule — Never Compare Your Returns With Anyone
Never.
Because:
-
Everyone has different capital
-
Different timeframes
-
Different risk appetite
-
Different life goals
Your only competition is:
✅ Your past self
✅ PART 6 (Next): Beginner Plans, Systems, Mistakes, Scams & How to Build a Wealth Machine
It will include:
✅ 1-share method
✅ Beginner-to-pro learning path
✅ Simple trading systems
✅ SIP frameworks
✅ Goals-based investing
✅ Top 20 mistakes
✅ All India-specific scams to avoid
✅ Realistic wealth-building examples
✅ Beginner Plans, Growth Systems, Mistakes, Scams & Your Wealth Machine (The Zero-to-Expert Blueprint)
⭐ The Biggest Lie Most Indians Believe About Investing
Most people think:
“I need a lot of money to start investing.”
This is completely wrong.
You can start investing with:
✅ ₹10
✅ ₹100
✅ ₹500
✅ ₹1,000
The amount doesn’t matter.
What matters is:
✅ discipline
✅ consistency
✅ patience
✅ a system
The market doesn’t reward rich people.
The market rewards consistent people.
⭐ The 1-Share Strategy — The BEST Beginner Method in India
Forget fancy courses.
Forget complicated trading.
Forget “How to pick multi-baggers.”
Start with just buying ONE share at a time.
Example:
✅ Month 1
Buy 1 share of ITC (₹460)
✅ Month 2
Buy 1 share of HDFC Bank (₹1,480)
✅ Month 3
Buy 1 share of Asian Paints (₹3,000)
✅ Month 4
Buy 1 share of Titan (₹3,400)
✅ Why this method is brilliant
Because:
✅ Affordable
✅ Zero pressure
✅ You learn by DOING
✅ You experience holding a stock
✅ You experience green days & red days
✅ You learn dividends, splits, bonus
✅ You get emotionally trained
✅ You build a small, safe portfolio
Even with ₹500–2,000 per month, you become a REAL investor.
⭐The Beginner SIP Plan (India’s Most Reliable Wealth Generator)
The safest, most reliable way to build wealth in India:
✅ SIP in a Nifty 50 Index Fund
✅ SIP in a Nifty Next 50 Fund
✅ Optional: Gold/SGB once a year
✅ Emergency fund separately
Let’s build a SIP plan:
✅ SIP Example (₹1,500/month)
Total: ₹1,500/month
Stay invested for 10–20 years.
Expected outcome (not guaranteed):
₹1,500/month for 20 years @ 12% → ₹11–13 lakh
✅ SIP Example (₹5,000/month)
20 years → ₹35–45 lakh (approx)
✅ SIP Example (₹10,000/month)
20 years → ₹70–90 lakh
⭐ The “5 Bucket System” — For People Who Want a Full Wealth Plan
This system is so simple even a school student can use it.
Imagine your money split into 5 buckets.
The goal is:
✅ Keep your life stable
✅ Keep investing simple
✅ Avoid using long-term money for short-term needs
⭐A Beginner-to-Pro Learning Path
Let’s build your learning from Day 1 → Year 3.
✅ Phase 1 (0–30 days): Basic Setup & Safety
-
Open Demat account
-
Do first buy (1 share rule)
-
Learn limit/market order
-
Understand risks
-
Learn basics of taxes
-
Start a small SIP
Outcome: You become a real investor.
✅ Phase 2 (Month 2–5): Start Building Your Mindset
-
Read basic investing books (1 per month)
-
Learn how to use charts
-
Understand sectors
-
Learn stop-loss
-
Track 3–5 companies
Outcome: You understand how markets behave.
✅ Phase 3 (Month 6–12): Controlled Trading Practice
-
Paper trade for 30 days
-
Do tiny value trades (1–5 shares)
-
Learn 2 simple chart patterns
-
Practice 1:2 risk-reward
-
Try GTT orders
Outcome: You learn discipline without losing big money.
✅ Phase 4 (Year 2): Intermediate Level
-
Build ₹1–2 lakh portfolio
-
Add SGBs
-
Add bonds
-
Add Nifty Next 50
-
Study 1 sector deeply (banking, pharma etc.)
-
Learn F&O basics (no trading yet)
Outcome: You think like an investor, not a gambler.
✅ Phase 5 (Year 3): Growth Stage
-
Increase SIP 10% each year
-
Build income streams
-
Add REIT/INVIT
-
Consider learning options selling (slowly)
-
Start a small research journal
Outcome: You are ahead of 95% Indians in financial literacy.
⭐ Simple Trading Systems for Beginners (Only 3 You Need)
These are not “get rich quick” systems.
They are beginner-safe, low-risk frameworks.
✅ System 1: Moving Average Crossover (School-Level Simple)
Use:
✅ 20-day moving average
✅ 50-day moving average
Buy when 20 EMA goes above 50 EMA.
Exit when 20 EMA goes below 50 EMA.
Works best for:
-
Nifty
-
ETFs
Not good for:
-
Penny stocks
-
Low-volume stocks
✅ System 2: Support/Resistance Bounces
Find a stock that touches the same price multiple times.
Example:
420 = support.
Buy when price bounces again.
Place stop-loss just below support.
✅ System 3: Breakout Trading (For Slightly Advanced Beginners)
Identify a horizontal line where stock keeps failing to go above.
Example:
If it breaks 1500 with high volume → Buy.
Stop-loss below breakout zone.
⭐ The 20 Biggest Mistakes Indian Beginners Make
Let me list them exactly as they happen in real life.
✅ Mistake 1: Buying stocks because someone on Telegram said so
✅ Mistake 2: No stop-loss
✅ Mistake 3: Expecting to double money quickly
✅ Mistake 4: Watching profit but ignoring risk
✅ Mistake 5: Buying penny stocks
✅ Mistake 6: Overconfidence after 1 profit
✅ Mistake 7: Revenge trading
✅ Mistake 8: Borrowing to trade
✅ Mistake 9: Using entire salary to invest
✅ Mistake 10: Checking prices 40 times a day
✅ Mistake 11: Too many stocks (over-diversifying)
✅ Mistake 12: Too few stocks (concentrating)
✅ Mistake 13: Selling winners early
✅ Mistake 14: Holding losers forever
✅ Mistake 15: Buying after huge news
✅ Mistake 16: Not studying companies
✅ Mistake 17: Entering F&O without basics
✅ Mistake 18: No emergency fund
✅ Mistake 19: Ignoring taxes
✅ Mistake 20: Lack of patience
If beginners fix these, success becomes MUCH easier.
⭐ India-Specific Scams & How to Avoid Them
This may be the most important chapter for safety.
Let’s expose all the real scams.
✅ Scam 1: Telegram & WhatsApp “Tips Groups”
They promise:
-
100% returns
-
Jackpot calls
-
Guaranteed profits
These are ALL scams.
✅ Scam 2: Screen Sharing Scam
Scammer says:
“Sir, I will help you install the trading app.
Share your screen.”
Then:
-
Installs AnyDesk
-
Takes control of phone
-
Steals OTP
-
Sells your shares
✅ Scam 3: Fake Broker Apps
Fraudsters create:
-
Fake brokers
-
Fake trading apps
-
Fake profit dashboards
Always check:
✅ SEBI registration
✅ NSE/BSE membership
✅ CDSL DP number
✅ Scam 4: Pump-and-Dump Scheme
Someone tells you:
“Buy this 5 rupee stock, big news coming!”
They pump the stock → you buy → they dump → price crashes → you lose.
✅ Scam 5: F&O “Guaranteed Profit Packages”
They promise:
“Give ₹25,000, we will trade for you.”
Illegal.
Fraud.
Never do this.
⭐ Building Your First Wealth Machine
Let’s combine everything we learned into 1 complete machine.
Assume you earn:
₹20,000/month
You can invest ₹5,000/month.
Here is the perfect plan:
✅ Step 1: Emergency Fund
Build ₹10,000–₹20,000 buffer.
✅ Step 2: Monthly SIP (₹3,000)
✅ Step 3: Stocks (₹1,000)
Use the 1-share rule.
✅ Step 4: SGB (once a year)
Invest ₹5,000–₹10,000 when issue opens.
✅ Step 5: Cash (₹1,000)
For sudden opportunities.
✅ Expected outcome after 10 years:
✅ ₹6–8 lakh corpus
✅ SGB gold returns
✅ Equity compounding
✅ A personal finance habit
✅ Fully protected financial lifestyle
⭐ 30-Day Beginner Challenge (So You Learn Without Losing Money)
Try this for 30 days:
✅ Week 1
-
Buy 1 share of any bluechip
-
Learn candle basics
-
Read 10 pages of an investing book
-
Watch 1 company news per day
✅ Week 2
-
Start ₹500 SIP
-
Learn stop-loss
-
Learn limit & market order
-
Do 2–3 tiny trades
✅ Week 3
-
Create a watchlist of 10 companies
-
Learn support/resistance
-
Learn risk-reward
-
Do 5 paper trades
✅ Week 4
-
Review your activity
-
Fix mistakes
-
Make a long-term plan
-
Add ₹100–500 more to your SIP
This challenge ensures you learn completely risk-free.
✅ TECHNICAL ANALYSIS MASTER PART
⭐ What Is Technical Analysis, Really?
Most people think Technical Analysis (TA) is:
❌ Some magic formula
❌ Some secret guru chart pattern
❌ Random lines on a chart
❌ Buy when green, sell when red
Wrong.
Technical Analysis is simply:
✅ Studying price
✅ Studying volume
✅ Understanding crowd psychology
✅ Identifying trends
✅ Recognizing momentum
✅ Protecting yourself with good entries/exits
It’s NOT predicting the future.
It’s calculating probabilities.
Think of TA like weather forecasting:
-
Clouds forming? Possible rain.
-
Humidity rising? Possible storm.
-
Wind direction changing? Possible shift.
TA helps you read the market weather.
⭐ Timeframes — The Foundation Before Any Indicator
Before any indicator works, you must understand timeframes.
Different timeframes = different behaviours.
✅ For beginners:
-
Intraday → 5m + 15m
-
Swing trading → 1H + Daily
-
Investing → Daily + Weekly
If you use the wrong timeframe → all indicators fail.
⭐ Candlestick Patterns — The Alphabet of Technical Analysis
Before learning indicators, you MUST learn candles.

Candles can be categorized as a bullish(green) or bearish(red) candle usually. The colors can be customized to any color of your choice depending upon the technical analysis software you use.
To read candlesticks one has to pay a closer attention to the overall body of the candle.
Above image tells us the same. There are three parts in a single candle, let us try to understand bullish(green) candle first.

- The main body or real body, rectangular in shape it connects the opening and closing price
- Upper shadow link the high point to the close
- Lower Shadow joins the low point to the open
Let us see now the bearish(red)candle:

- The main body or real body, rectangular in shape it connects the opening and closing price. However, bearish candles is opposite to bullish candles, the opening is at the top end and the closing is at the bottom end of the rectangle.
- Upper shadow link the high point to the open
- Lower Shadow joins the low point to the close
I don’t think, I need to explain what is open, high, low, close? they are self explanatory if you see the candle. However for reference this what OHLC means:
Open – When the markets open for trading, the first price at which a trade gets execute is called the opening price.
High – This tells us the highest price at which the market participants (traders or investor) are willing to transact for the given day.
Low – This shows the lowest level at which the market participants (traders or investor) are OK to transact for the given day.
Close – Closing price is the most important price, as it is the final price at which the market closed for a particular period of time.
Closing price also useful as an indicator for the intraday strength. If the close is higher than the open, then it is considered a positive day(bullish) otherwise negative(bearish).
If you have the OHLC data with you, now you can easily plot both the candlesticks (bullish and bearish). However, you do not need to do this manually, the software does it for you.
You just need to take a look at the various points to understand its opening, closing, high, low value.
Range of the candle:
The length of the candle (upper shadow to lower shadow) denotes the range, it moves depending upon the time frames you have chosen (1min, 5min, 30min, day, week, month etc.) for candlestick charts. It gets calculated by subtracting the high from the low of the candlestick.
Range = High – Low
Range also indicates the volatility, higher the range more is the volatility and vice versa. Another key point is of short candles, it can be considered that the trading action was gloomy for the day without much movement.
You can consider the shadows as tests of a price range. whereas, Candles with no shadow indicate a strong trend in one direction.
So, just to sum up these are things you need to look seeing a candlestick:
Price:
Opening price / Closing price/ stock price went up or down
Shadows/wicks:
The lower shadow shows Lowest level for the time frame / The upper shadow shows highest level for the time frame
Bearish(red) candle:
A red candlestick shows the open price at the top of the body / A red candlestick shows closing price at the bottom of the body.
Bullish (green) candle:
A green candlestick shows the open price at the bottom of the body / A green candlestick shows the closing price at the top of the body
Below charts depicts, how does a candlestick chart look like when combine with data point on a software analysis tool.

Now, that you know the basics of how to read a candlestick, learn different pattern formations and how to use them while trading or investing in stock market.

⭐ SUPPORT & RESISTANCE — The Skeleton of Every Chart
Think of:
✅ Support = floor
✅ Resistance = ceiling
Price keeps bouncing between floor and ceiling.
✅ Support Example
Stock touches ₹150 three times:
This means:
✅ Buyers protect this level
✅ If price falls below → big drop possible
✅ Resistance Example
Stock fails at ₹200 repeatedly:
This means:
✅ Sellers are strong
✅ If price breaks above → big rally possible
In a very simple terms support means to hold up something, so that it does not fall further. In the world of trading and investing support is a tool to find a point or a level on a chart that prevents the price of a stock/index from falling further. Surprisingly, you will find most of the buying activities here.
Support is the level at which the demand is powerful enough to stop the stock/index from falling any further. Whenever the price falls to the support point, it is expected to bounce back.
The rationale behind any stocks to bounce back is the demand due to falling of share price. It’s a very common logic people often use, even buying normal things in life.
If you can get 10% discount, instead of full price, people feel its worth buying, thinking maybe I won’t get this at those prices in future.
However it may happen the thing you have bought may be available at much discount tomorrow.
One thing to keep in mind, you will find support level always below the current market price. So whether you are trading stocks, or any index, you will find the support level below its current price.
⭐ MOVING AVERAGES (SMA, EMA) — The Simplest Trend Tool
Moving averages smooth price movements.
✅ Simple Moving Average (SMA)
Example: 20 SMA
Average of last 20 candles.
If price stays above 20 SMA → uptrend
If price stays below 20 SMA → downtrend
✅ Exponential Moving Average (EMA)
EMA gives more weight to recent candles → faster signals.
For beginners:
✅ 20 EMA
✅ 50 EMA
✅ 200 EMA
✅ Practical Uses of MA
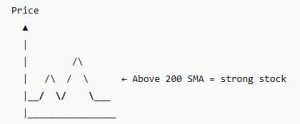
Scenario 1: Long-term investing
Look at 200 SMA
Scenario 2: Trend trading
Use 20 EMA & 50 EMA crossover
Works on Nifty, Bank Nifty, ITC, Reliance.
What Are Best SMA periods to use in Trading?
The major popular moving averages used by most traders are the 10, 20, 50, 100 and 200 days. I have listed below which is best according to type of trading one do in market.
- 5 -SMA – This is for the hyperactive traders. The shorter the SMA period, the more signals you will receive when trading. The best way to use a 5-SMA is in conjunction with a longer SMA period.
- 10-SMA – popular with short-term traders, best for swing traders and intraday traders.
- 20-SMA – For short-term traders or investors, beyond the 20-SMA, you are looking at primary trends.
- 50-SMA – used by traders or investors to scale mid-term trends.
- 200-SMA –These are for long-term trend followers. As an investor you should look for a cross above or below this average to represent if the stock is in a bullish or bearish trend.
You can read complete guide on Simple Moving Average and Best Strategies Here.
⭐ RSI (Relative Strength Index) — The Mood Detector
RSI shows momentum.
Range: 0 to 100
✅ RSI above 70 → Overbought
✅ RSI below 30 → Oversold
But beginners misunderstand:
RSI is NOT a buy or sell signal alone.
✅ How RSI Actually Helps
Scenario 1: Price touches support, RSI 25
High chance of bounce.
Scenario 2: Price near resistance, RSI 75
High chance of rejection.
✅ RSI Divergence (The advanced but useful concept)
Price making lower low:
RSI making higher low:
This often signals reversal.
The RSI indicator is much more than a buy and sell signal indicator. Do not think it is only useful for day trading, for an investors perspective RSI has better things to offer too. It is because RSI can provide you the ability to gauge the primary direction of the trend.
You can read RSI Indicator based intraday trading strategies here.
⭐ MACD — The Trend + Momentum Combo
MACD indicator is indisputably very popular momentum(trend) indicator used in technical analysis in stock market. MACD is a acronym used for Moving Average Convergence Divergence.
MACD indicator is a combination of two different exponential moving average.
Out of the two moving averages one is of shorter time period (12day EMA) and the other longer time period (26day EMA). It gets calculated by subtracting 26 day EMA from 12day EMA.
This results in giving a MACD line. After that, a 9day ema also called as signal line is plotted on the top of the MACD line to generate a trigger for buy and sell signal for any stock or index.
One can buy (go long) the security when the MACD (line) crosses above its signal line (9day EMA line) and sell (go short) the security when the MACD crosses below the signal line.
The MACD are useful for measuring market momentum as well as possible price trends and is employed by many traders and investors to identify potential entry and exit points in market.
MACD has 3 parts:
✅ MACD line
✅ Signal line
✅ Histogram
✅ How MACD Works
When MACD crosses above the Signal line → bullish
When MACD crosses below → bearish
Works fantastic on:
✅ Nifty
✅ Bank Nifty
✅ Large caps
✅MACD Trend Example
Crossovers = turning points.
You can read MACD Indicator based intraday trading Strategies here.
⭐ Bollinger Bands (BB) — The Volatility Detector
BB has 3 lines:
✅ Middle = 20 SMA
✅ Upper band
✅ Lower band
Bands expand = volatility increasing
Bands contract = volatility decreasing
✅ Bollinger Squeeze — Major Breakout Signal
When BB becomes tight:
Expect big breakout or breakdown.
This works AMAZINGLY on:
-
Nifty
-
Bank Nifty
-
Reliance
-
HDFC Bank
Read more about Bollinger Bands Here
⭐ VWAP — The KING of Intraday Indicators
VWAP = Volume Weighted Average Price.
Shows:
✅ Fair price of the day
✅ Where big players are buying
Rules (intraday):
✅ Price above VWAP → bullish
✅ Price below VWAP → bearish
VWAP combined with RSI = powerful intraday formula.
⭐ Fibonacci Retracement — The Market’s Natural Math
Fib levels:
✅ 23.6%
✅ 38.2%
✅ 50%
✅ 61.8%
✅ 78.6%
The most powerful = 61.8%
✅ How to use Fib (Beginners)
If stock moves from ₹100 → ₹150
Then retraces:
Fib levels:
-
23.6% → 138
-
38.2% → 131
-
50% → 125
-
61.8% → 119 (most important)
Price often bounces at 61.8%.
Read more about Fibonacci Here
⭐ Volume — The Lie Detector of Breakouts
Volume tells you how many shares are traded.
Rule:
✅ Breakout + HIGH volume = Strong
✅ Breakout + LOW volume = Fake
You can read more on volume based strategies in stock market here
⭐ Combining Indicators — The REAL Power
Indicators alone = weak
Indicators + context = strong
Let’s build combinations.
✅ Combination 1: Moving Average + RSI
Use case: Trend + Overbought/Oversold
Example:
-
Price above 50 EMA
-
RSI dips to 30
-
Price at support
→ HIGH probability BUY.
✅ Combination 2: VWAP + RSI (Intraday)
Rules:
✅ Price above VWAP → look for buys
✅ RSI bounce from 30 → buy entry
Simple and powerful.
✅ Combination 3: Bollinger + Volume (Breakouts)
Watch for:
-
BB squeeze
-
Volume spike
-
Price closing above upper band
→ Breakout confirmed.
✅ Combination 4: Fibonacci + Support/Resistance
When price retraces:
✅ Fib 61.8% overlaps with support → strong buy zone.
⭐ 3 Complete Beginner Strategies (Ready-to-Use)
Now the part you will LOVE.
These are beginner-safe, no-nonsense strategies.
✅ Strategy A: 20-50 EMA Trend System
(For Nifty, Bank Nifty, Reliance)
Buy when:
-
20 EMA crosses above 50 EMA
-
Volume above average
-
RSI above 40
Sell when:
-
20 EMA crosses below 50 EMA
This works best in trending markets.
✅ Strategy B: RSI + Support Bounce
(For swing trading)
Buy when:
-
RSI < 30
-
Price near major support
-
Bullish candle pattern
Sell when:
-
RSI near 60–70
-
Price near resistance
Simple, effective.
✅ Strategy C: VWAP Intraday Entry
(For beginners doing small trades)
Buy when:
-
Price crosses above VWAP
-
Retests VWAP
-
RSI between 40–60
-
Bullish candle on retest
Stop-loss: just below VWAP
Target: 1:2 RR
This is the safest intraday system.
⭐ Common Technical Analysis Mistakes Beginners Make
✅ Using too many indicators
✅ Trading against the trend
✅ Not waiting for confirmation
✅ No stop-loss
✅ Trading based on “patterns only”
✅ No understanding of volume
✅ Changing strategy too often
Keep it simple.
✅ Glossary, FAQs, Final Recommended Broker Section, Summary & Conclusion
✅ BEGINNER FAQs
Q1. What is a Demat account?
A digital account where your shares are stored safely.
Q2. What is a Trading account?
Used to place buy/sell orders.
Q3. What is the minimum money required to start investing?
You can start with ₹100, even ₹10 for UPI-based mutual funds.
Q4. Is trading safe for beginners?
Only with stop-loss and proper risk rules. Best to start as an investor.
Q5. Is investing better than trading?
Investing is safer and compounding works better long-term.
✅ ORDERS & BROKER FAQs
Q6. What is CNC?
Cash & Carry — for long-term investing.
Q7. What is MIS?
Intraday only — position closes at 3:20 PM.
Q8. What is a GTT order?
Trigger order valid for months.
Q9. What are DP charges?
Fee charged when you SELL delivery stocks.
Q10. Is account opening free?
Many brokers offer FREE opening & ZERO AMC.
✅ TECHNICAL ANALYSIS FAQs
Q11. Which indicator is best for beginners?
Moving Averages + RSI + VWAP for intraday.
Q12. What is the best timeframe?
5m/15m for intraday, 1H/1D for swing, 1D/1W for investing.
Q13. How accurate are indicators?
Indicators are probabilistic, not guaranteed.
Q14. What is a breakout?
Price breaking above resistance or below support with volume.
Q15. What is a pullback?
Temporary drop in an uptrend.
✅ INVESTING FAQs
Q16. Which fund is best for beginners?
Nifty 50 Index Fund.
Q17. Is SIP safe?
Yes, long-term SIP reduces risk and increases compounding.
Q18. Should I buy stocks or mutual funds?
Start with funds → add stocks slowly.
Q19. Best time to invest?
Anytime — market timing doesn’t matter long term.
Q20. How many stocks should I hold?
8–15 good companies are enough for beginners.
✅ DERIVATIVES FAQs
Q21. What is F&O?
Futures & Options — high-risk leveraged instruments.
Q22. Should beginners trade options?
NO — avoid until 1–2 years of learning.
Q23. Why do most option buyers lose money?
Time decay + low edge + emotional trading.
Q24. What is option selling?
Advanced strategy requiring margin and deep understanding.
Q25. What is a lot size?
Fixed quantity per F&O contract.
✅ TAX FAQs
Q26. What is STCG tax?
15% on equity profits held < 1 year.
Q27. What is LTCG tax?
10% on profits above ₹1 lakh for holdings > 1 year.
Q28. How are intraday profits taxed?
As normal income (slab rate).
Q29. How are F&O profits taxed?
As business income.
Q30. Are dividends taxed?
Yes — added to your income slab.
✅ PSYCHOLOGY & SAFETY FAQs
Q31. Is stock market gambling?
No — gambling is chance, market is skill & discipline.
Q32. How to avoid losses?
Use stop-loss, avoid leverage, follow risk rules.
Q33. How to avoid scams?
Avoid Telegram groups & screen-sharing requests.
Q34. What is FOMO?
Fear of missing out — leads to bad trades.
Q35. Why do beginners lose money?
No plan, no risk management, emotional decisions.
✅ ADVANCED FAQs
Q36. Can I invest in the US market?
Yes, via brokers supporting US stocks or ETFs.
Q37. What is a bonus share?
Extra shares given free by company.
Q38. What is a stock split?
Company reduces price per share & increases quantity.
Q39. What is rebalancing?
Adjusting your portfolio by selling high and adding to low.
Q40. Should I buy during market crashes?
Yes — use staggered buying (4-part buying method).
✅ PRACTICAL FAQs
Q41. How much return can I expect yearly?
Equity historically returns 10–14%.
Q42. How to track my investments?
Use your broker, Value Research, Tickertape, Screener.
Q43. Can I invest without Aadhaar?
No. Aadhaar + PAN are mandatory.
Q44. How long does Demat activation take?
5 minutes to 24 hours.
Q45. Which stocks are safest?
Large caps & index funds.
⭐ Final Recommended Broker Section
Dhan Overview — Company, Background & Credibility
-
Founded by Pravin Jadhav (ex-Paytm Money CEO).
-
SEBI registered, NSE/BSE member, CDSL depository.
-
Focused on active traders — not just investors.
-
100% Indian fintech company.
Quick Facts Table:
Parameter |
Details |
|---|---|
Founded |
2021 |
Founder |
Pravin Jadhav |
Headquarters |
Mumbai, India |
SEBI Reg. |
INZ000XXXXXX |
Depository |
CDSL |
Active Users (2025 est.) |
2+ million |
Platforms |
Web, Mobile, Dedicated Options App |
Dhan Brokerage & Charges
-
₹0 on equity delivery
-
₹20 or 0.03% (whichever lower) per executed order for intraday, F&O, commodity, and currency.
-
No hidden charges, no minimum balance.
Other Fees:
Service |
Charges |
|---|---|
Account Opening |
₹0 |
Annual Maintenance (AMC) |
₹0 |
Pledge/Unpledge |
₹12.5 per request |
Auto-square off |
₹20 per order |
Verdict: ✅ Transparent, simple, and competitive.
Dhan Trading Platforms (Web + App + Dedicated Options App)
1. Dhan Web
-
Full-fledged professional interface
-
Real-time charts powered by TradingView
-
Fast execution & 20-depth market view
-
Multi-tab workspace for multiple scripts
2. Dhan Mobile App
-
Clean, intuitive UI
-
Live option chain data
-
Pre-built strategies for beginners
-
Advanced indicators & pattern recognition
3. Dhan Options Trader App
-
Specifically designed for options traders
-
Built-in strategy builder (free)
-
IV, PCR, Max Pain analytics
-
“Payoff” graph for visual risk/reward analysis
Advanced Features That Make Dhan Stand Out
🧩 1. Native TradingView Integration
-
Direct chart trading from TradingView.
-
Place, modify, or cancel orders from the chart — no toggling screens.
⚡ 2. Scalper Mode
-
For high-frequency intraday traders.
-
Execute orders instantly with one tap.
💡 3. Iceberg & Super Orders
-
Split large trades automatically for better execution.
-
Set entry, SL, and target in one click.
🔍 4. ScanX Screener
-
Technical + fundamental screener with live trends.
-
Detect breakouts, momentum shifts, and candlestick patterns.
🔔 5. Trader Controls
-
Smart alerts to prevent over-trading or margin exhaustion.
-
Ideal for disciplined trading.
🤖 6. API & Algo Trading
-
Free API access for all users.
-
Compatible with Python, TradingView alerts, or third-party platforms.
Margin & Leverage (MTF)
Dhan offers up to 4× leverage (75% funding) for equity delivery under Margin Trading Facility (MTF).
-
You can buy delivery shares by paying only 25% upfront.
-
Pledge existing holdings for additional leverage.
Intraday Margin:
-
Equity: Up to 5x
-
Index Options: 1x to 2x (based on liquidity)
-
Futures: Full margin applicable as per SEBI norms
Charting, Technical Analysis & Tools
-
TradingView & ChartIQ both supported.
-
Multiple indicators (200+ built-in).
-
Multi-timeframe charts.
-
Advanced drawing tools.
-
Auto-detection of candlestick patterns.
Pro Tip:
Dhan’s native TradingView integration is unique — you can trade directly from your chart, not just analyze. Perfect for scalpers and short-term traders.
Order Types & Execution
-
Market, Limit, SL, SL-M orders
-
Cover Orders (CO), Bracket Orders (BO)
-
Forever Orders (GTT equivalent)
-
Iceberg, Super Orders, and Basket Orders
Average order execution speed: <20 milliseconds
That’s faster than almost every other Indian broker.
Dhan for Options Trading
If you trade Nifty, Bank Nifty, or FINNIFTY options — Dhan’s Options Trader App is one of the most advanced in India.
Key Highlights:
-
Full options chain with Greeks
-
Built-in Strategy Builder
-
IV, OI, PCR, Max Pain, and Intrinsic Value analytics
-
Ready-made & customizable strategies
-
Instant margin calculator
-
Payoff chart visualizer
Verdict:
Dhan is currently the #1 options trading app in India — combining speed, analytics, and zero additional charges for strategy tools.
Dhan for Intraday Trading
For active intraday traders, Dhan delivers:
-
Super-fast execution (20ms latency)
-
Scalper Mode for one-tap trading
-
Advanced chart-based orders
-
Real-time depth (20 levels)
-
Smart order types like Iceberg
In a 3-month real test :
-
No major downtime
-
Execution accuracy >99.8%
-
Average slippage <0.03%
Verdict:
Perfect for scalpers, day traders, and short-term positional setups.
If you’re looking for a modern, feature-rich, and trader-friendly platform, Dhan is easily one of the best choices available today. From zero account opening charges to advanced tools like native TradingView, options strategy builder, and free API access, Dhan is clearly built with the modern Indian trader in mind.
Whether you’re an intraday trader, an options strategist, or a long-term investor, Dhan offers the perfect blend of speed, simplicity, and smart technology — without burning a hole in your pocket.
Why wait? Open your Dhan account now and take control of your trading journey with confidence.
👉 Click here to get started with Dhan
Open a Free Dhan Trading & Demat Account
Dhan offers cutting-edge tools for fast, powerful, and informed trading:
- ✅ Zero brokerage on delivery trades
- ✅ Auto-detection of candlestick patterns on charts
- ✅ Advanced Option Chain with Greeks, Max Pain, PCR & more
- ✅ Pre-built & custom Option Strategy Builder (Free)
- ✅ 20 Depth Market Data and Flash Trade execution
- ✅ Margin Trading Facility (MTF) with 4X leverage (75%)
- ✅ 3 Platforms: Mobile App, Web App & Dedicated Options App
- ✅ ScanX Screener: stock insights, trends & news
- ✅ Advanced orders: Trailing SL, Iceberg, Forever Orders
- ✅ Instantly pledge 1,500+ stocks for options margin
- ✅ Trade commodities: Gold, Silver, Crude, Natural Gas
- ✅ Fundamental + Technical analysis across all platforms
No paperwork. Zero account opening charges. Setup in minutes.
Customer Support & Reliability
-
24×7 email and chat support
-
Dedicated trading desk for active traders
-
Fast response via Telegram and Twitter
User Ratings:
| Platform | Rating | Reviews |
|---|---|---|
| Play Store | ⭐4.6 | 200K+ |
| App Store | ⭐4.5 | 70K+ |
| Web App | Highly rated for speed & UI |
✅ Beginner Roadmap Summary
How to Open a Dhan Account
-
Visit https://dhan.co
-
Click “Open Free Account”
-
Upload PAN, Aadhaar & bank details
-
Complete eSign using Aadhaar OTP
-
Start trading instantly (no paperwork)
💥: Open Free Dhan Account Now – 100% online in under 5 minutes.
⭐ A–Z Beginner Glossary
✅ A
AMC (Annual Maintenance Charge)
Yearly charge for your Demat account.
ASBA
Method of applying for IPOs where money stays in your bank until allotment.
✅ B
Bear Market
Market going down; people are fearful.
Bid Price
Price buyers are offering.
Bluechip Stocks
Strong, big companies like Reliance, HDFC Bank, TCS.
Bollinger Bands (BB)
Indicator showing volatility using upper/lower bands.
✅ C
CAGR
Annualized return — tells how fast your money grew per year.
Candlestick
Shows open, high, low, close for a time period.
CDSL
Depository where your shares are stored digitally.
CNC (Cash & Carry)
Buying shares to hold long term (no leverage).
Cutoff Price (IPO)
Final price at which shares are allotted.
✅ D
DP Charges
Fee taken when you SELL shares from Demat.
Delivery
Buying shares and holding them (investing).
Dividend
Cash profit companies give to shareholders.
✅ E
EMA
Faster moving average giving weight to recent candles.
ETF
Basket of stocks you can buy/sell like a share.
✅ F
F&O (Futures & Options)
Derivative trading instruments with high leverage and risk.
Fibonacci Levels
Mathematical retracement levels used to predict pullbacks.
Fundamental Analysis
Studying a company’s business, profits, management, etc.
✅ G
GTT Order
Long-duration trigger order valid for months.
G-Secs
Government bonds considered extremely safe.
✅ H
Hammer
Candle pattern indicating reversal from bottom.
Holdings
Stocks currently in your Demat account.
✅ I
Intraday Trading
Buy and sell in the same day.
IPO
Company selling shares to public for the first time.
Index Fund
Mutual fund tracking Nifty/Sensex.
✅ J
Journal
Record of your trades (very important for learning).
✅ L
Limit Order
Buy/sell at a specific price.
Liquidity
How easily a stock can be bought/sold.
✅ M
MACD
Indicator showing trend + momentum.
MIS
Intraday product type with auto square-off.
Market Order
Buy immediately at best available price.
✅ N
NRML
Product type for holding F&O positions overnight.
✅ O
Overbought (RSI > 70)
Price may be too high, potential fall.
Oversold (RSI < 30)
Price may be too low, potential bounce.
✅ P
Premium (Options)
Price paid to buy an option.
Portfolio
Collection of all your investments.
Pledge
Using your stocks as collateral for margin.
✅ R
Resistance
Price ceiling where stock struggles to go up.
Retracement
Temporary pullback in price.
Risk–Reward Ratio
Profit potential compared to risk taken.
✅ S
SIP
Monthly automatic investment.
Slippage
Difference between expected price and executed price.
SL/SL-M
Stop-loss order types.
Support
Price floor where stock bounces.
✅ T
Trend
Direction of the market — up, down, sideways.
TPIN (CDSL)
Security PIN used to authorize share selling.
✅ V
VWAP
Intraday fair price based on volume.
Volatility
How fast price moves.
✅ W
Watchlist
List of stocks you track.
✅ Y
Yield
Return on bonds or dividends.
⭐ Conclusion — Your Complete Path to Financial Freedom in India
You now understand:
✅ How Demat accounts work
✅ How to choose a broker
✅ Order types & charges
✅ Stocks, ETFs, MFs, IPOs, Bonds, SGBs, REITs
✅ Technical analysis basics
✅ Strategies for beginners
✅ Taxes
✅ Risk management
✅ Psychology
✅ Asset allocation
✅ Common scams
✅ A 3-year roadmap to success
No one becomes wealthy overnight.
You build wealth with:
✅ Discipline
✅ Knowledge
✅ Small, consistent steps
✅ Smart decisions
✅ Controlled risk
✅ Patience
Every great investor started small —
with ₹100, ₹500, or one share.
You have now completed a guide better than 99% paid courses in India.
This is your complete, lifelong blueprint for trading & investing safely and successfully.
If, you have liked the content please do share it with your friends or on social media, as sharing do bring the good karma. If you have any questions or feedback you can leave them in comment box below.
🔗 Related Learning
- How To Invest In Indian Stock Market – Explained With Examples For Beginners
- Mastering Intraday Trading: A Beginner’s Guide to Profitable Strategies in the Indian Stock Market
Note: Please do not take this as any recommendation, to trade or invest. This is just for reference, to make you understand about how share market works in India, under no circumstances intended to be used or considered as financial or investment advice, a recommendation or an offer to sell, or a solicitation of any offer to buy any securities or other form of financial asset.
Please do your own research and make investment. Moneycontain will not be responsible for any of your losses at all. The point made is for educational purpose only. All investments are subject to risks, which should be considered prior to making any investments.